Claude Code, Anthropic's terminal agent, pointed at a folder of data with a short instruction file, writes the SQL, runs it, draws the chart and drafts the readout. Your job is to check the number.
Build this analyst one step at a time: setup, your first questions, the checks, and the context that makes it repeatable. Day 1 arrives right away. See all 23 emails.
Free. Unsubscribe anytime.
Five steps
Install Claude Code and clone the analyst. Install Claude Code, clone github.com/ai-analyst-lab/ai-analyst, run pip install -e ".[dev]" in the folder (add the warehouses extra for Snowflake or BigQuery), and start claude there.
Run /setup and connect a data source. Inside Claude Code, type /setup. It asks who you are, what you work on and what data to connect, then wires up a CSV folder, a DuckDB file or a warehouse and writes the context into .knowledge/.
Ask a question you already know the answer to. Start with a number you have computed before, such as average order value by month. If it matches, ask something harder. If it does not, tell it what went wrong and why, so the correction is stored for the next query.
Read the SQL it ran. Queries go through the repo's connection manager and are logged. Ask for the trace, or open the log, and read the query behind the number before you read the number.
Ask the same question again. Run the question more than once and see whether the definition holds. If the runs pick different definitions, write the one your team uses into the metric dictionary. Then compare the number with a source you trust.
Claude Code will produce a number for any question you type, and it looks the same whether the definition behind it is your team's or one it picked on the fly. That is why steps three to five matter. What the repo adds on top of Claude Code, and how to extend it, is on how to build an AI data analyst.
A recorded run: NPS, support tickets and an iOS release
This is from the free session Analyze Product Data with Claude Code Opus 4.6, recorded February 27, 2026. The data is NovaMart, a synthetic store with, in Shane's words, "like 50k users, 13 tables, and a full year of behavioral data." Quotes come from the auto-generated transcript, and [brackets] fix words it misheard.
The first prompt asked about the data before any business question, so a guessed schema gets caught before any SQL runs: "Hey, tell me about the data sets available here, like the Novomart data set." It came back with the tables and the quirks on file, like "Some columns are stored as float due to nulls cast them as int before joining." Someone hit that problem earlier and wrote it down. His comment: "That's not necessarily going to happen out of the box."
Then: "What's our overall NPS score?" One query, one number: "So our overall NPS is plus is 42.3." Shane followed straight up by asking how it was calculated and from what data, and it named its source: "I [queried] the NPS responses table in the Novomart data set." He does this even on metrics he knows: "Even if I know what the metric is, I like to confirm that it is aligned with me on the metrics."
From detractor comments to a payment spike
He asked it to dig into why detractors were unhappy and to say if other data could validate it. It read the comments (payment trouble, the app crashing, a confusing mobile checkout) and checked them against the support tickets table without being told to: "Delivery and payment dominate support tickets, too, which correlates with NPS." It also caught a flaw in the data: "About half the detractor comments are actually positive." Shane: "This is the quirk of me creating synthetic data."
Asked to look over time, it found "a payment issue spike in late May, early June," and on request drew a chart that pulled payment tickets out from the other categories so the spike stood alone.
The root cause
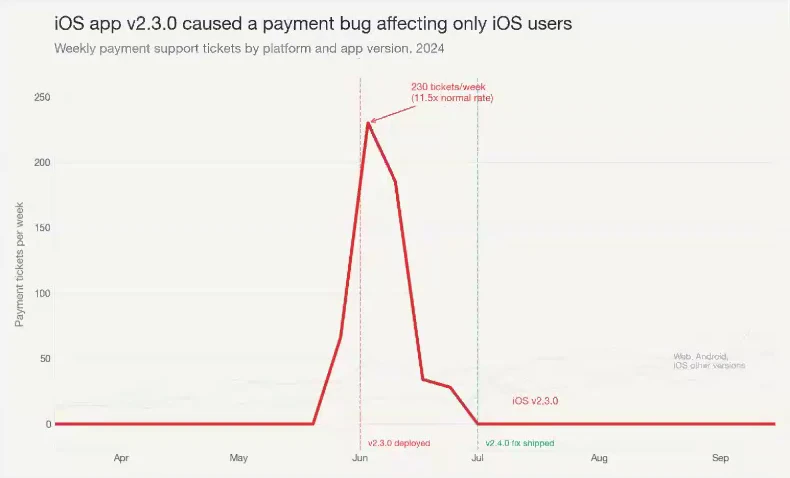
"So what? Like, what should we do next?" It picked the payment incident as "the most concrete thread" and sent sub-agents after several hypotheses at once. One checked whether an experiment explained the tickets. Another found the app version: "The app version is a smoking gun version 2.3 appeared during the incident window. with 465 tickets. It didn't exist before that incident." And: "100% of the 2.3 payment tickets came from iOS."
The SQL behind the experiment check
Most queries were collapsed in the terminal. This one was on screen long enough to read, run from a short Python block against the NovaMart DuckDB file. It is transcribed from the recording at about 50:40 (open the video there) with the Python wrapper left out.
SELECT
    e.experiment_name,
    ea.variant,
    COUNT(DISTINCT t.ticket_id) as payment_tickets,
    COUNT(DISTINCT ea.user_id) as users_in_variant,
    ROUND(1.0 * COUNT(DISTINCT t.ticket_id) / COUNT(DISTINCT ea.user_id), 3) as tickets_per_user
FROM experiment_assignments ea
JOIN experiments e ON ea.experiment_id = e.experiment_id
LEFT JOIN support_tickets t
    ON ea.user_id = t.user_id
    AND t.category = 'payment_issue'
    AND t.created_date BETWEEN '2024-05-20' AND '2024-06-14'
GROUP BY 1, 2
ORDER BY 1, 2
The printed result:
=== PAYMENT TICKETS BY EXPERIMENT VARIANT (incident window) ===
  checkout_redesign / control: 111 tickets from 5000 users (0.022 per user)
  checkout_redesign / treatment: 102 tickets from 5000 users (0.02 per user)
  save_for_later_visibility / control: 99 tickets from 5000 users (0.02 per user)
  save_for_later_visibility / treatment: 110 tickets from 5000 users (0.022 per user)
The window is May 20 to June 14, the filter is payment_issue, and the LEFT JOIN keeps users with no tickets in the denominator. All four groups come out at 0.02 or 0.022 tickets per user, and treatment is lower than control in one experiment and higher in the other. Neither experiment explains the spike. The model's note under the result: "The experiments both started after the incident window, so they're not the cause."
The repo's chart reviewer looked at the iOS chart before Shane did ("annotation is colliding with the subtitle. Let me clean it up."). This is the chart after that fix:
Frame from the recording at about 53:42 (open the video there). Synthetic NovaMart data.
Asked to "put these into a deck," it titled the deck with the finding ("Ios V. 2.3 broke payments for free users.") and closed on three actions, starting with "conduct a postmortem on ios v 2.3 with the mobile team."
A second question, run overnight
Shane had started another question the night before and let it run the whole pipeline without stopping for him. It took about 45 minutes: "why did conversion rate drop 4 points between Q1 and Q2? in which customer segments drove the decline." The aggregate funnel looked "broken across the board." The finding was that most of the drop came from growth changing the mix of users. Shane: "So it's like a mixed shift issue, not an actual funnel issue. So this is like Simpson's paradox." Simpson's paradox is when the total moves one way while the segments inside it move the other, because the mix of segments changed. He credited the validation stage: "Like, do the numbers add up?"
He also said he does not pass every recommendation along: "Crazy recommendation. You want to spin up a new dev team to build something? Like, I'm not going to recommend that."
Does Claude Code give the same answer twice
We measured this in Validate Claude Code Analytics Output (June 17, 2026) with the repo's reliability skill, which sends one question to five independent sub-agents and compares the results. The data sat in Snowflake.
"How are we doing on checkout conversion? Run it 5 times."
All five came back with 33.2 percent. Shane on why: "we have a metric dictionary that tells Claude what we mean when we say conversion rate." Then the same setup on a question with nothing in the dictionary:
"What's our retention rate?"
"Alright, so all 5 runs returned. This time, they're [scattered]." The five runs used four definitions of retention: active in the month after sign-up (two runs), a second completed order within 30 days, repeat purchasers over the full year, and more than one session in the first week. Each is a definition a real team uses. Agreement on its own proves little, as Shane put it: "A wrong query can be perfectly stable."
CLAUDE.md is a markdown file in the project folder that Claude Code reads at the start of every session. Shane calls it "like an analyst onboarding doc," and on why it beats a chat window: "chat forgets. This doesn't." The repo's own CLAUDE.md is long. A starter for a folder of CSVs looks like this:
# Analyst

You are a product analyst working in this folder. People bring you decisions
and data; you bring back numbers with the query behind them.

## Data
- Orders and sessions live in data/shop/ as CSV. One file per table.
- Dates are UTC. Use created_at for the order date; updated_at changes on refunds.
- "Active customer" means a delivered order in the trailing 30 days.
  Say which definition you used whenever you report a count.

## Rules
1. Ask what decision the answer serves before you query.
2. Profile first: row counts, date range, nulls, duplicate keys.
3. Every number gets a comparison: prior period, segment, or benchmark.
4. Show the SQL under every number.
5. When I correct you, write the correction to corrections.md and read
   that file before the next query.
The definition of an active customer is the line that makes two runs agree. It does the same job the metric dictionary did for checkout conversion.
Connect your data to Claude Code
The repo's connection manager handles CSV folders, DuckDB, Postgres, BigQuery, Snowflake, Databricks, Redshift, SQL Server and MySQL, and every query goes to the same log. Four common ones:
Source
What you do
Where the secret goes
Status in the public repo
CSV folder
Drop the files in a folder and give /connect-data the path. The repo serves the folder through an in-memory DuckDB, so each file becomes a table named after the file (orders.csv is queried as orders) and every query is logged like a warehouse query.
None.
Works with the base install; DuckDB is a core dependency.
DuckDB
Give /connect-data the path to the .duckdb file. It tests the connection with SELECT 1, then profiles the tables.
None.
Works with the base install. The course practice dataset is a DuckDB file.
Snowflake
Install the warehouses extra, then run /setup-snowflake. It asks for account, user, warehouse, database, schema and role, and before it reports success it queries CURRENT_ACCOUNT() to prove the session is on Snowflake.
A programmatic access token (or a password) in .env as SNOWFLAKE_TOKEN, never in the manifest.
Works. The June 17 session queried Snowflake live, with a hook logging every query.
BigQuery
Install the warehouses extra, run gcloud auth application-default login yourself, then /connect-data type=bigquery with your GCP project id and dataset name. It verifies the project and dataset before it reports success.
None in the repo. It uses Application Default Credentials and will not ask for a service-account key in chat.
Implemented in v3.1.1, with a setup guide. Its tests run against fake clients; we have not yet run it against a live project in a recorded session, so check the first few numbers against the BigQuery console.
Each connection is a manifest at .knowledge/datasets/{name}/manifest.yaml, copied from connection_templates/. The Snowflake one:
connection:
  type: snowflake
  authenticator: programmatic_access_token
  account: "{account_identifier}"   # e.g., xy12345.us-east-1
  warehouse: "{warehouse}"
  database: "{database}"
  schema: "public"
  user: "{username}"
  token: "$SNOWFLAKE_TOKEN"         # Secret belongs in .env, never in this manifest
Remote queries are opt-in, with AAP_USE_REMOTE=1 in the shell or use_remote: true in .knowledge/active.yaml. Without it, a warehouse manifest falls back to a local DuckDB or CSV copy when one exists. The setup skills show the remote identity (the Snowflake account, the BigQuery project) before they say anything is connected. If the check reports DuckDB or CSV, you are not on the warehouse, whatever the manifest says.
For anything else, Shane's advice was to ask: "you can just ask Claude like. Hey, I use BigQuery like let's get you connected."
Claude in the browser, Claude Cowork, and Claude Code
The same model reaches different data depending on where you run it. The rows come from our Cowork 101 session (August 26, 2026) and the two repo READMEs.
Claude in the browser
Claude Cowork
Claude Code
Where it runs
claude.ai chat, with code execution on the files you upload
The Claude desktop app, in a sandbox that reads the folder you point it at
Your own computer, with your installed tools, your Python and your credentials
Data it can reach
Files you upload to the chat
Your folders, plus warehouses such as Snowflake and BigQuery through connectors Anthropic provides
Any database or warehouse you can reach from Python, including ones behind a VPN
Saves work back
From the Cowork session: "it can't save anything back to your computer"
From the same session: "it reads your files and writes real files back"
Yes: briefs, charts, decks and the query log, in the project folder
The analyst method
None built in
The ai-analyst-plugin: the method and its skills, with memory in a .knowledge/ folder; the orchestrated pipelines and the maintained eval suite are left out
The full repo: skills, pipeline agents, Python helpers, the reliability skill and the eval harness
Cowork is the path if a terminal is what stops you, and the Cowork 101 recording doubles as its setup guide. Claude Code is the path if you need the query log, the eval harness, or a data source no connector reaches.
Questions
Do I need to know Python or SQL to analyze data in Claude Code?
Claude Code writes and runs the SQL and Python. Your part is reading the query it ran and checking the number against something you trust. In the recorded session every question was typed in plain English.
Does my data go to Anthropic?
Queries run on your machine or against your warehouse. The prompts and whatever context Claude reads, including query results it looks at, travel to the model provider unless you have set up and verified a local endpoint. The repo says this in its README and SECURITY.md.
Can I point it at Google Sheets or Excel?
Not as a data connection. Download the sheet as CSV into a folder and register the folder; each file becomes a table named after the file. The repo also documents an optional Google Workspace MCP setup for reading and writing Sheets, which Google still lists as a developer preview.
What does it cost to run?
A Claude plan that includes Claude Code, plus whatever your warehouse charges for the queries. The repo is MIT licensed and free.
Can I use it on my company data?
Yes, on your own machine and under your company rules. Our courses run on a synthetic dataset, and you apply the setup to your own data after the course.
Do I need this repo, or can I use plain Claude Code?
Plain Claude Code will write SQL against a CSV if you ask. The repo adds the method: it profiles the data before trusting it, pairs every number with a comparison, logs every query, checks its own work, and remembers your corrections between sessions. How to build an AI data analyst
Free email course
Claude Code Analytics, 23 emails over 9 weeks
Build this analyst one step at a time: setup, your first questions, the checks, and the context that makes it repeatable. Day 1 arrives right away. See all 23 emails.