February 14, 2026
Will Claude Code + Opus 4.6 Replace Your Data Team?
No code. I built an agentic data team that delivers full analyses in minutes instead of weeks.
After a few days of stress testing Opus 4.6, I’m convinced that this will replace most of what data scientists do today. Not just the execution. The queries, the charts, the slides, yes. But what surprised me was the judgment. The curiosity. The ability to frame a vague ask into a structured analytical question, generate hypotheses, and catch patterns that most human analysts would miss.
I built an AI data analyst inside Claude Code that takes any dataset and produces a full slide deck (charts, narrative, recommendations) in about 15 minutes. No Python. No SQL. No coding at all. The entire system is markdown files that Claude Code reads and follows. This post is the full walkthrough: how it works, what it produced on real data, and how you can build one yourself.
If you work with data in any capacity, this is for you. PM, DS, analyst, engineer who gets pulled into “can you look at this?” conversations. Could you take this to work on Monday and actually use it? By the end of this post, I think the answer is yes.
The tools
A few things worth explaining up front so you know what you’re looking at.
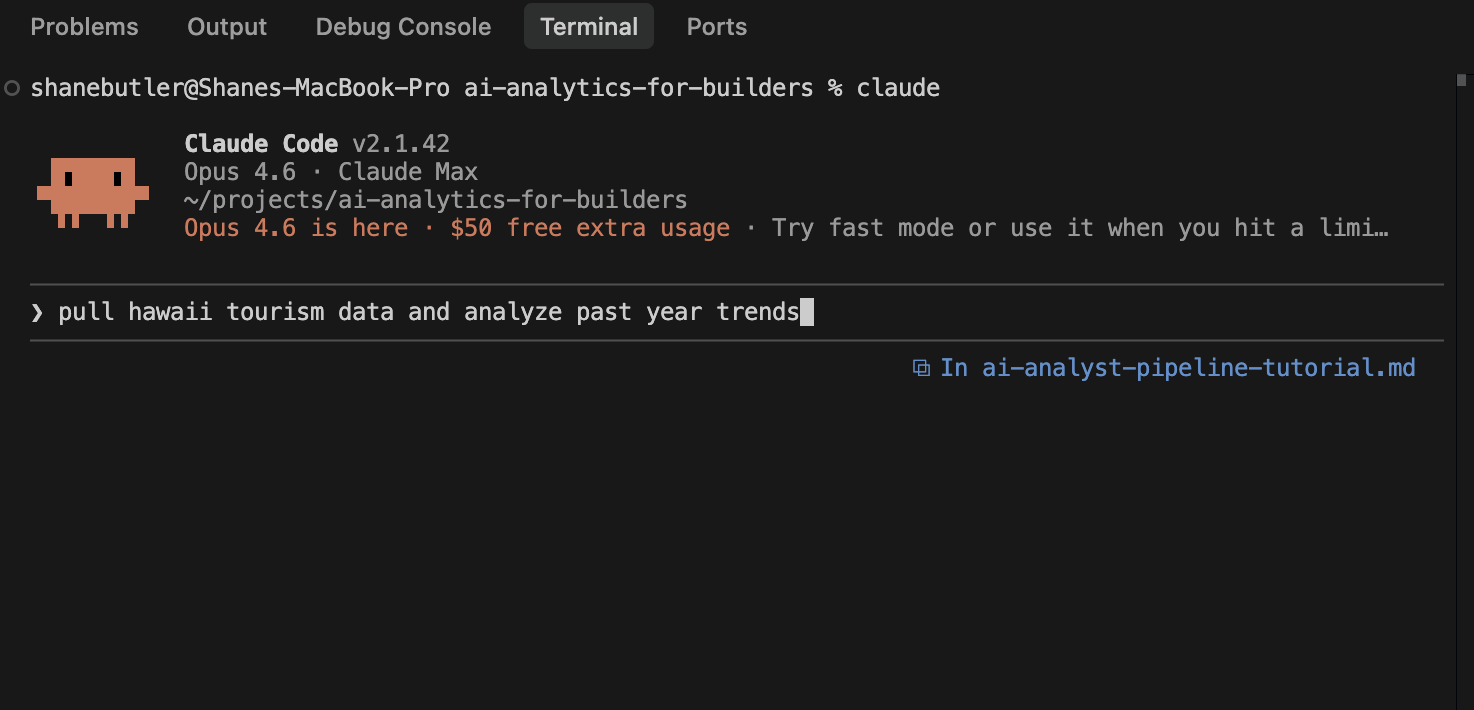
Claude Code is Anthropic’s AI coding agent. It runs in your terminal, or inside an IDE, and operates directly in your codebase. It reads your project files, writes code, executes commands, and follows instructions you define in markdown files. It’s an agent that works inside your project with full access to your files, your data, and your tools.
Opus 4.6 is the model powering Claude Code. Anthropic’s most capable model. It’s what gives the system its analytical judgment, its curiosity, and its ability to turn a vague ask into a structured analytical question. You select it when you launch Claude Code.
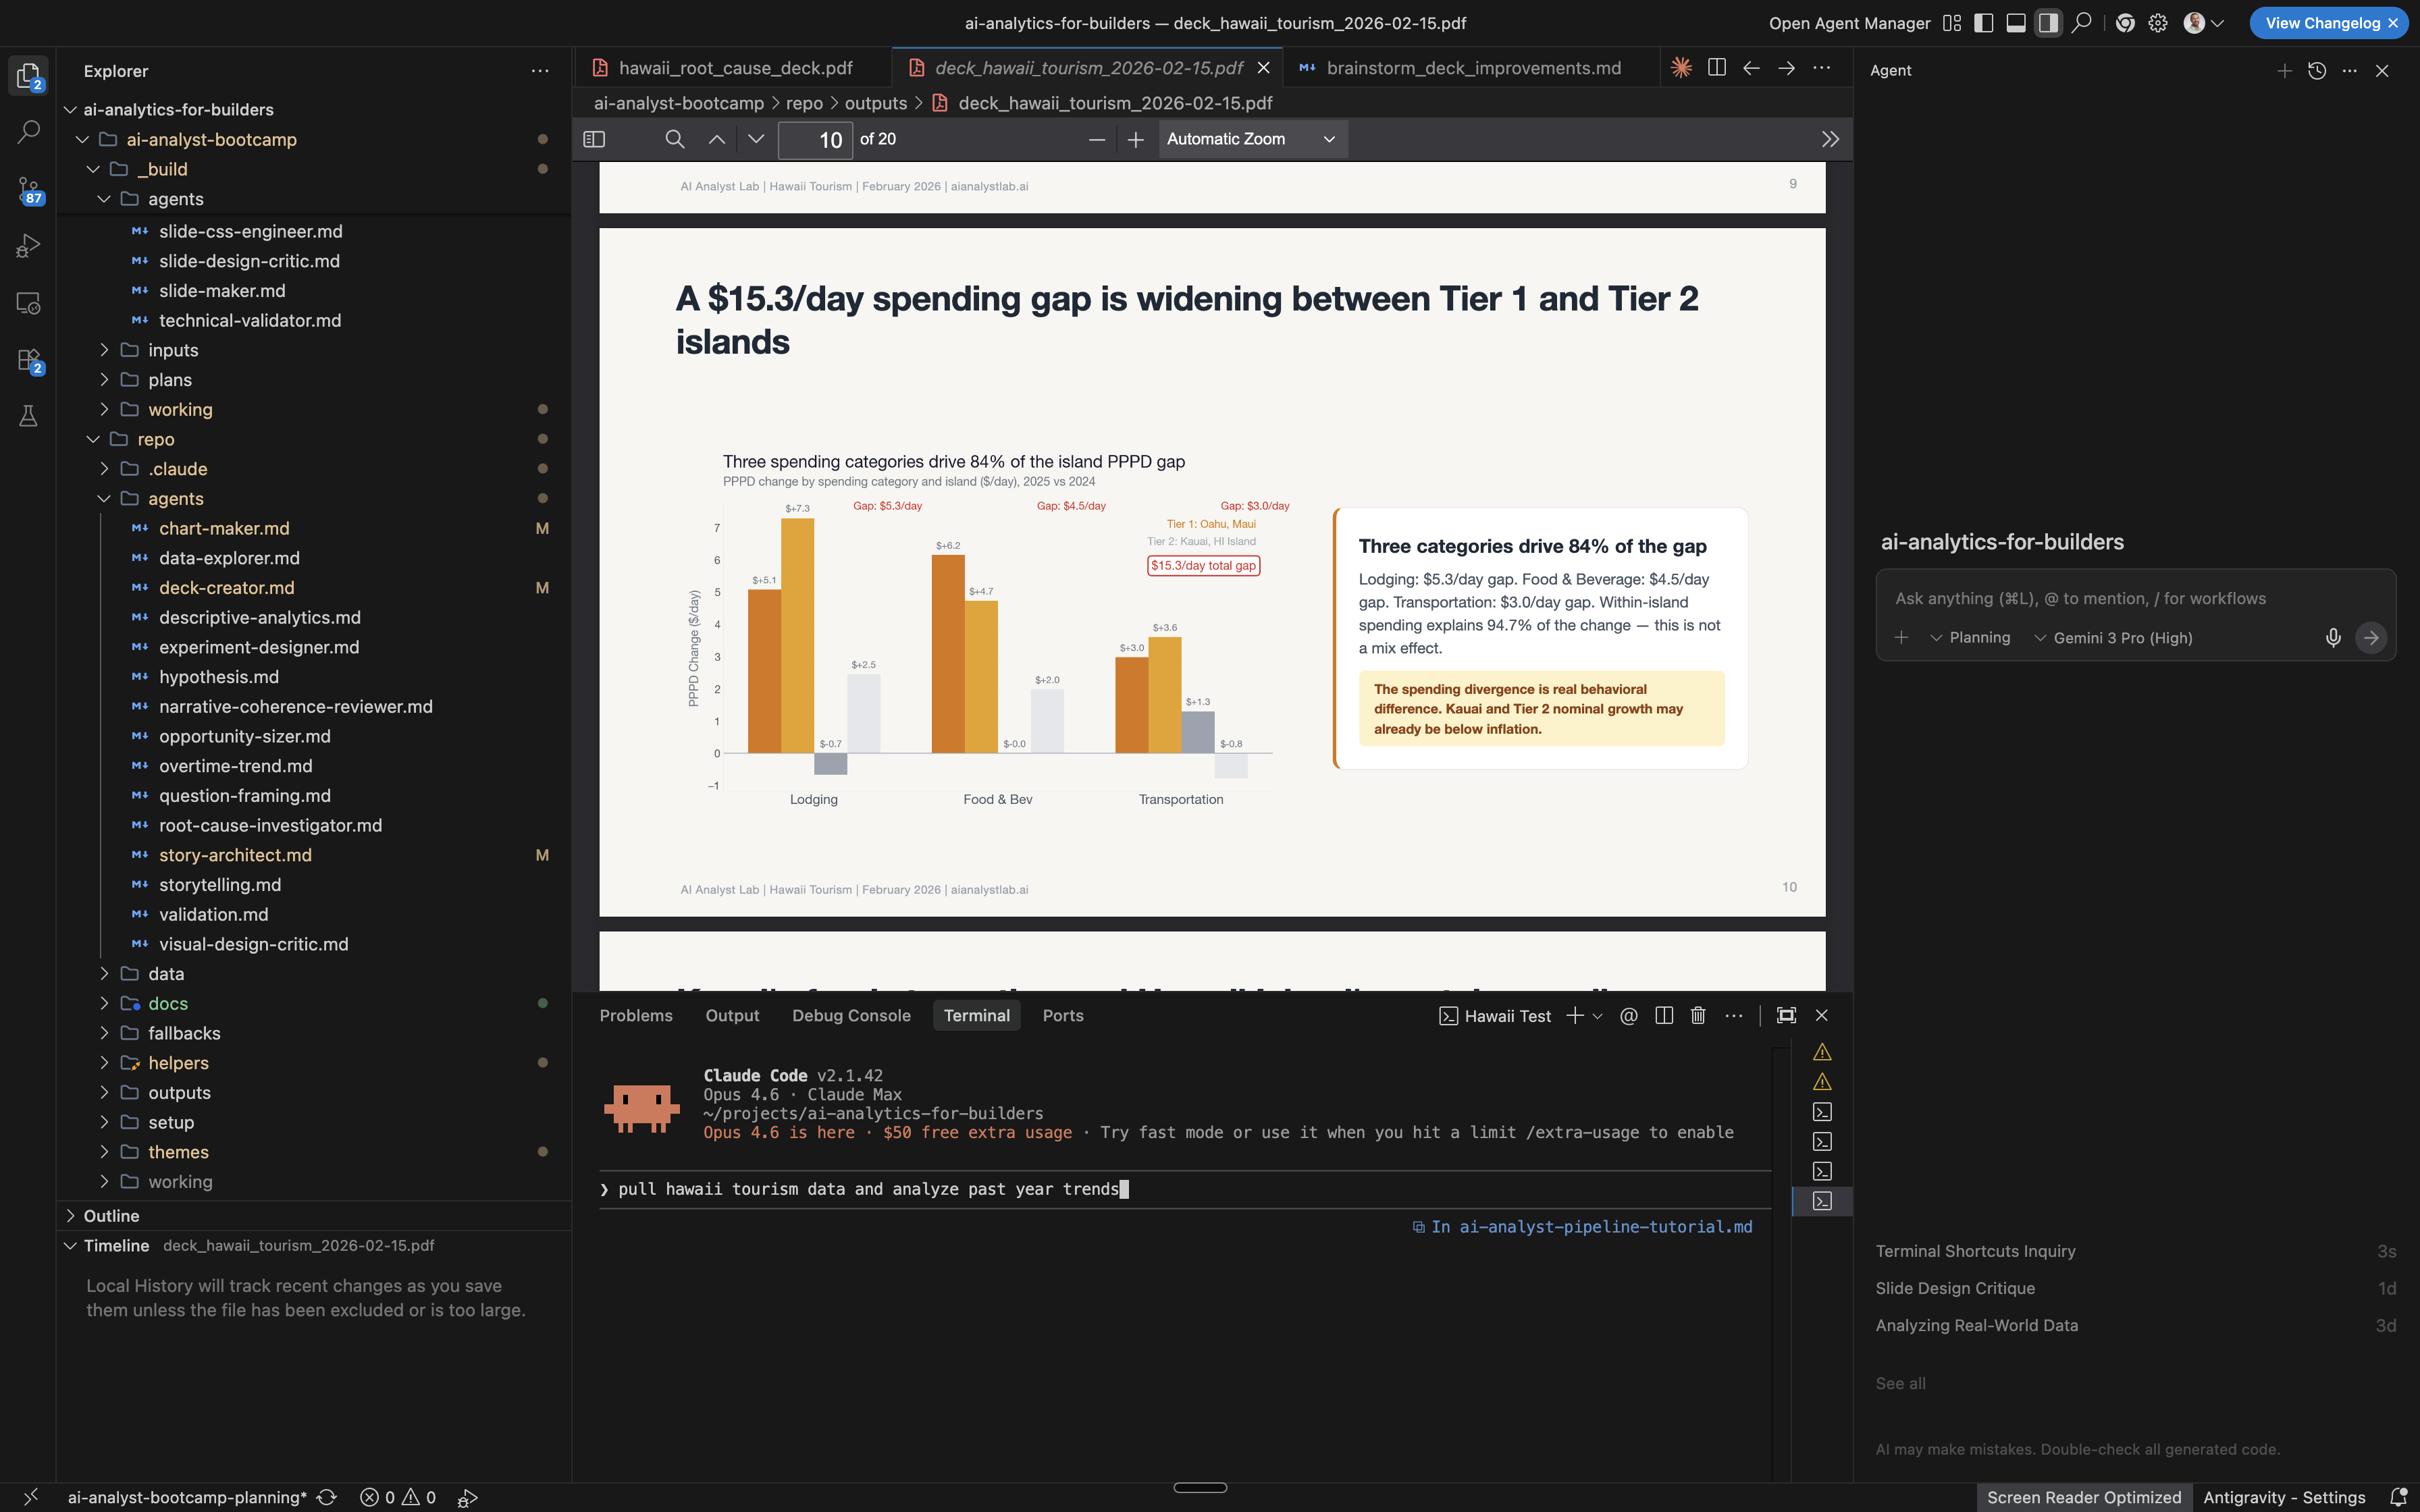
Google Antigravity is the IDE where this all runs. Think VS Code but with Claude Code built in natively. You can see the terminal, the file explorer, and the output side by side. Not required (Claude Code works in any terminal) but it’s a nice workspace for seeing everything at once.
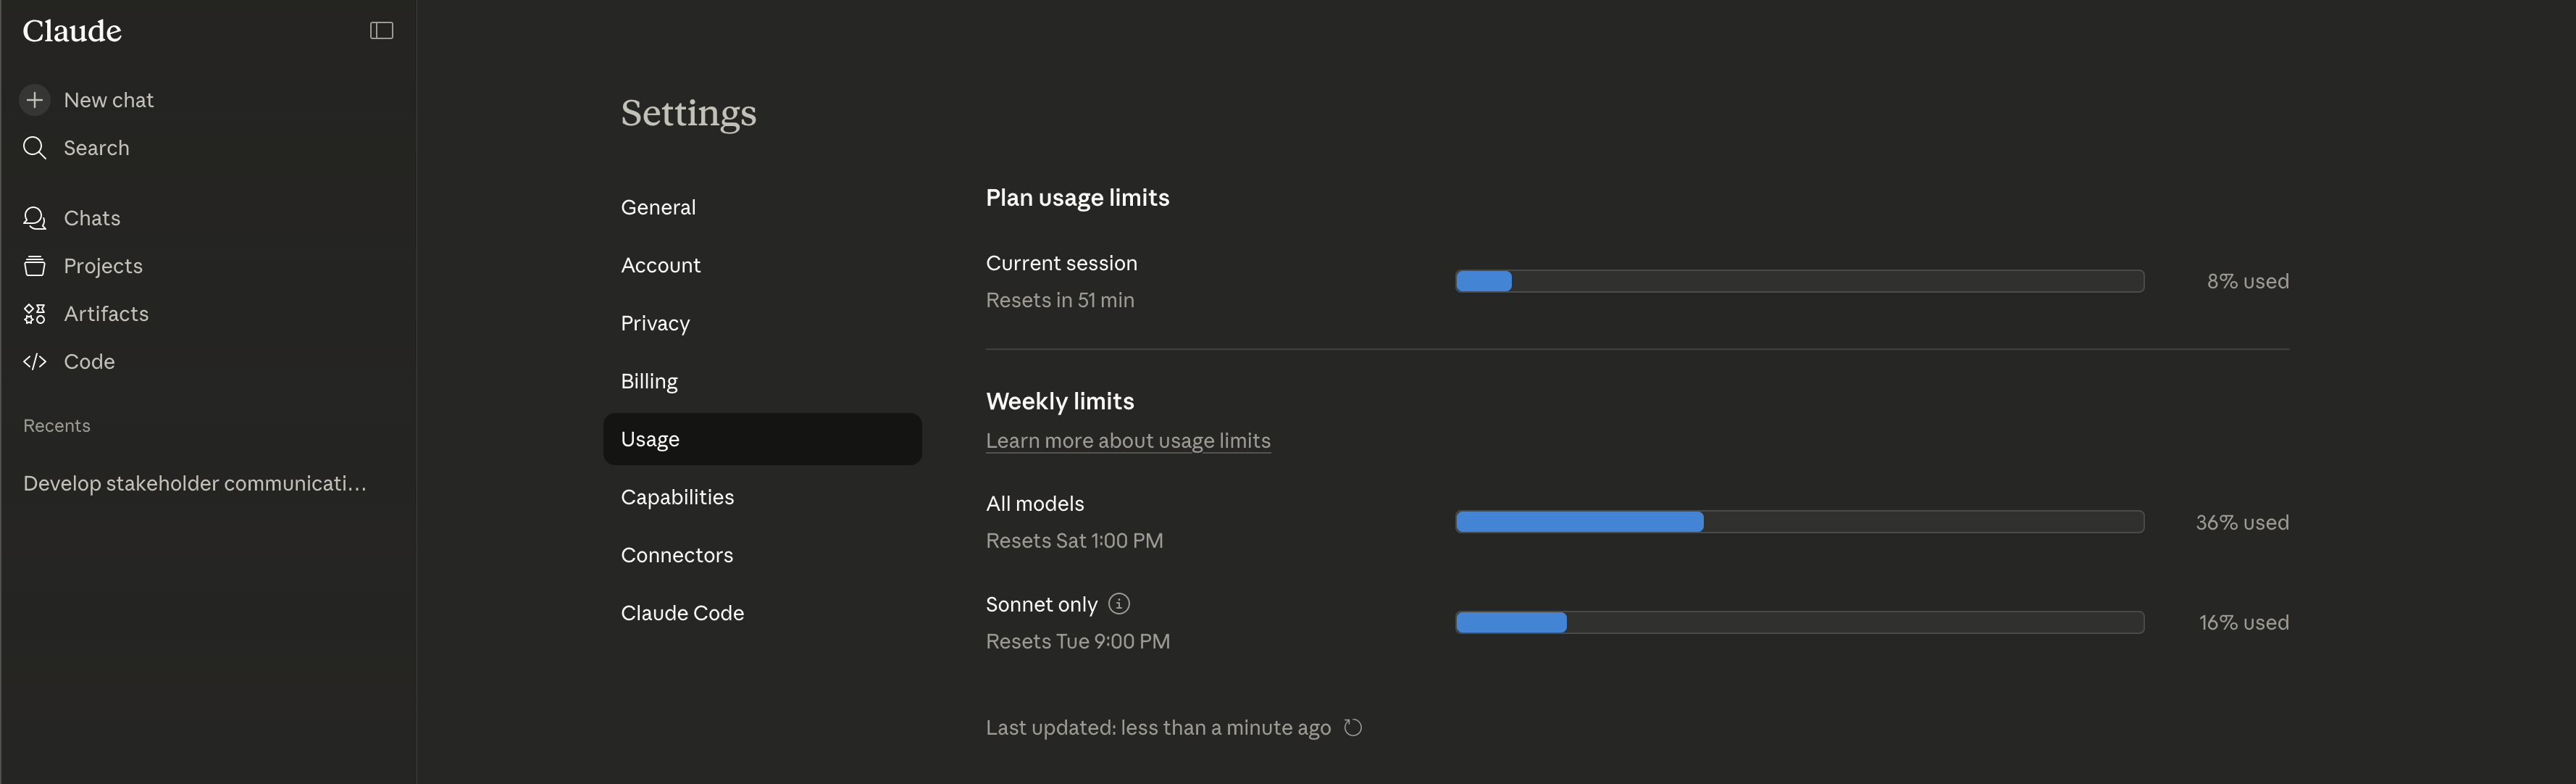
Cost and usage. Claude Code runs on your Anthropic subscription. Usage limits refresh every few hours and weekly. The entire Hawaii analysis, from raw CSVs to finished deck, ran within a single session’s limits.
Start with the output
Before I explain how any of this works, here’s what it produced.
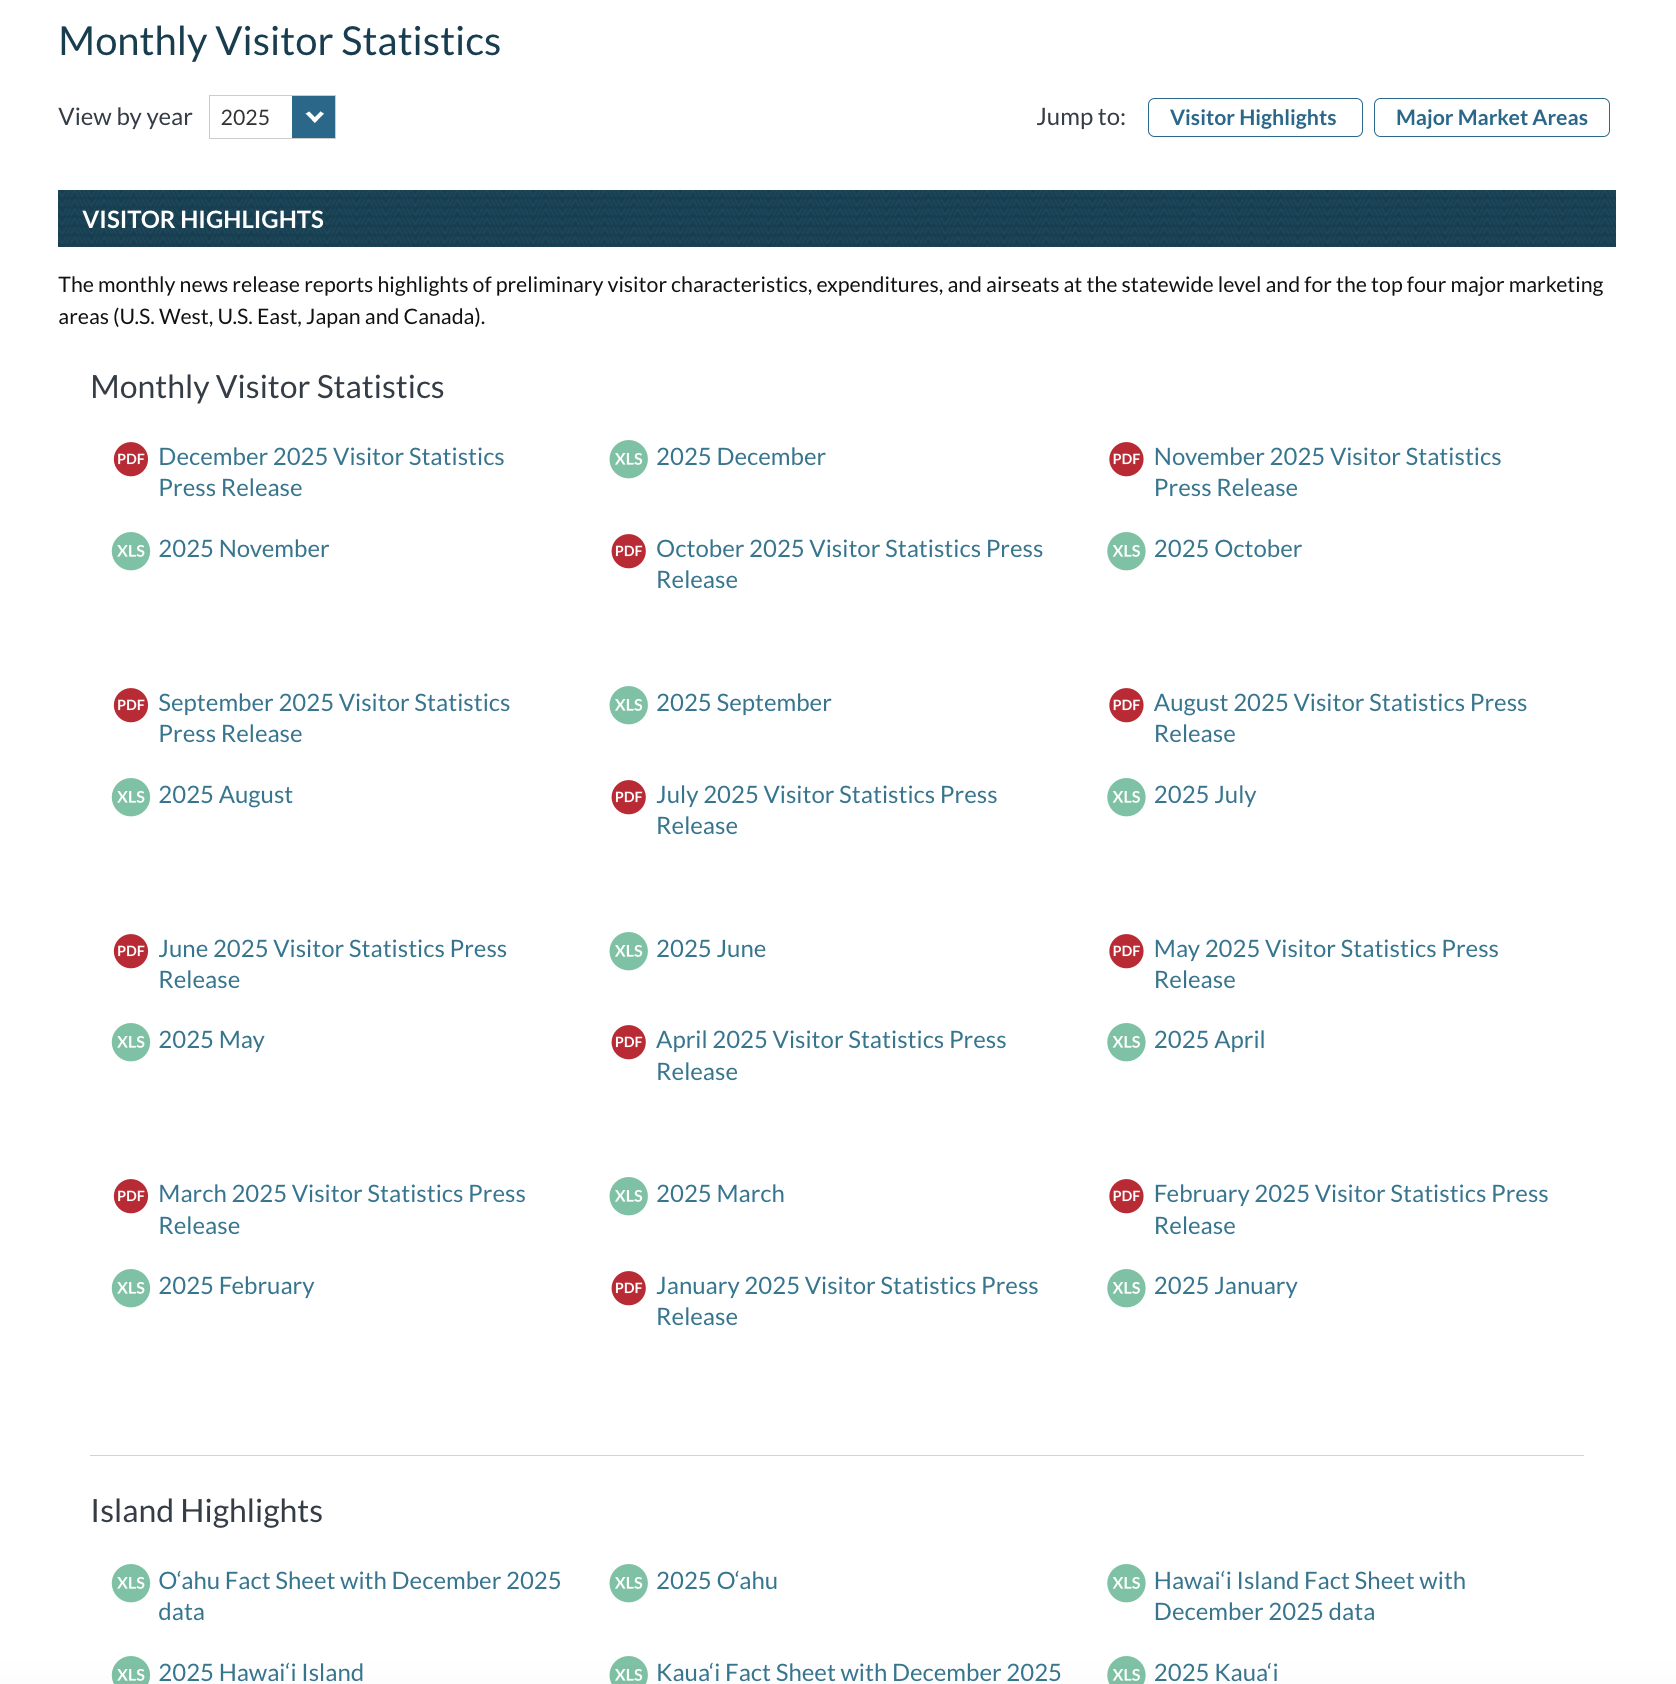
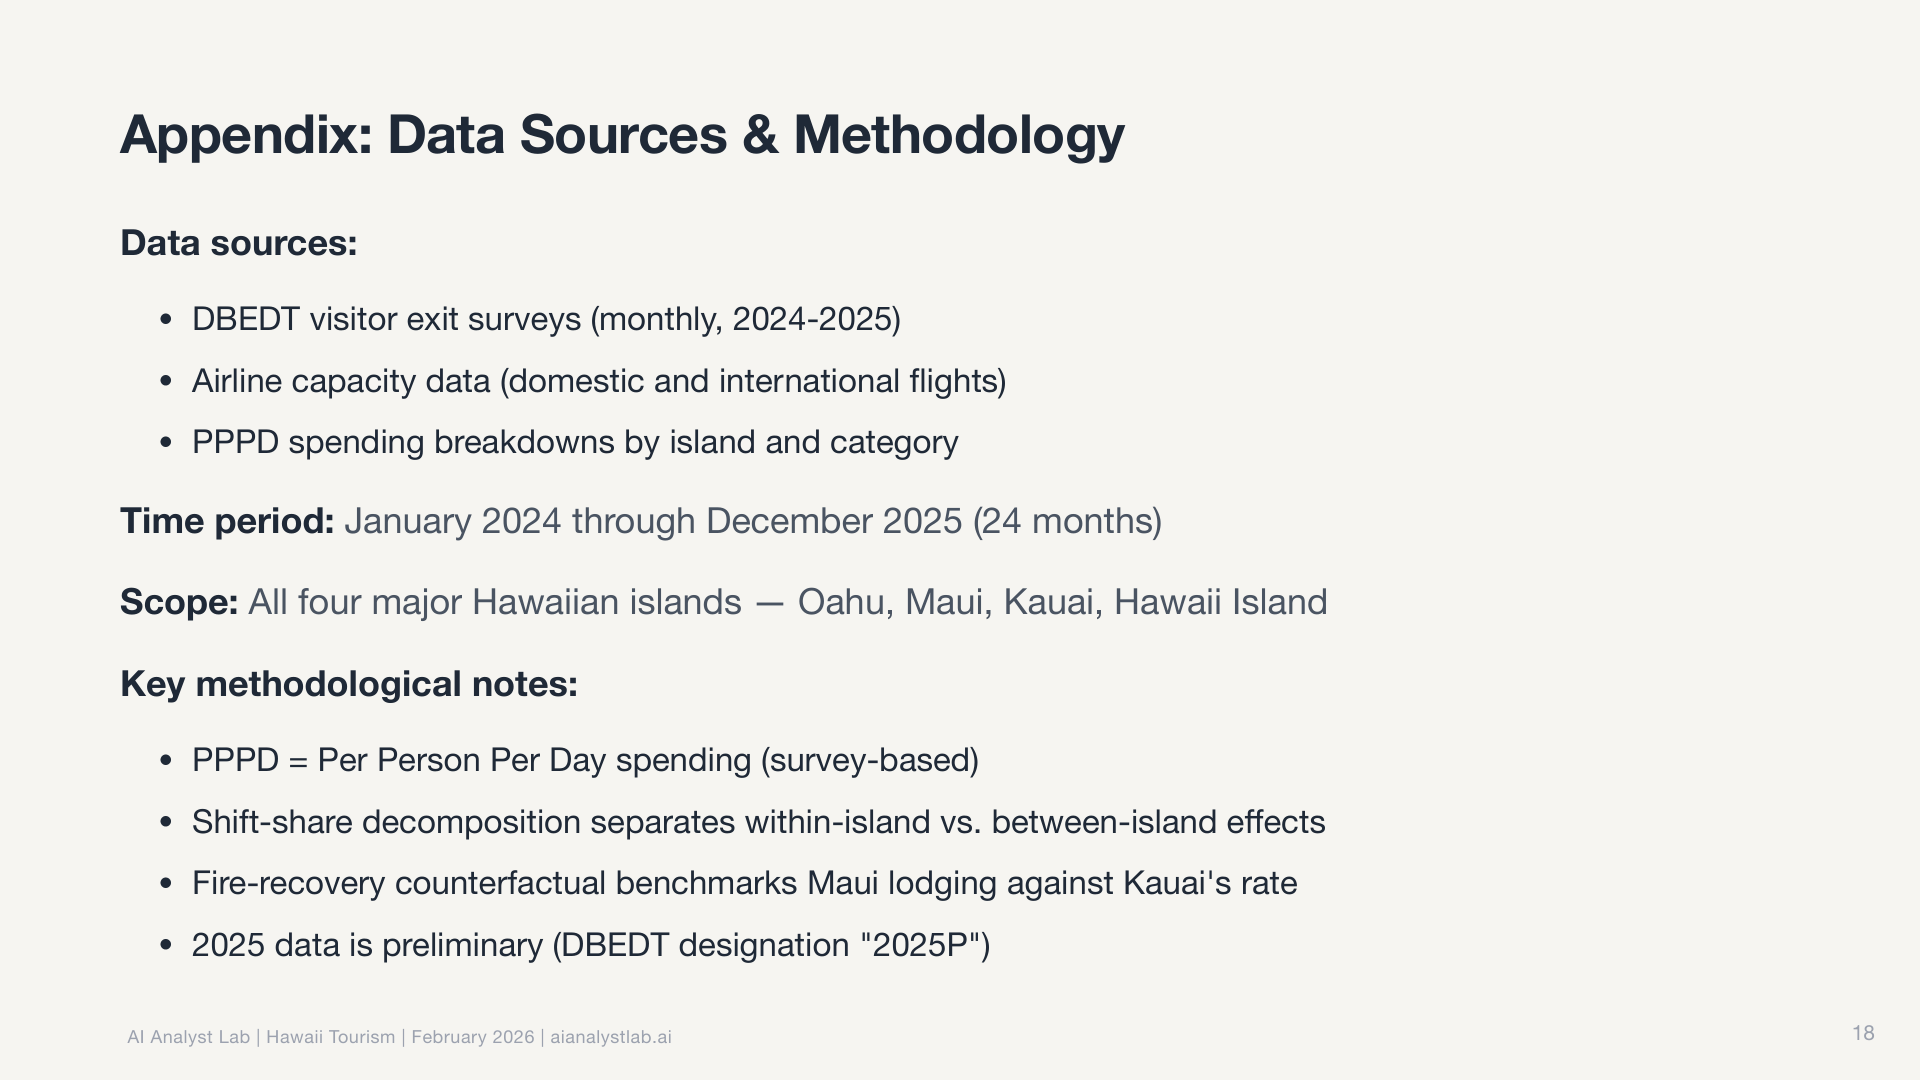
I pointed it at Hawaii Tourism Authority data and said “go analyze this.” Monthly visitor arrivals by island, country of origin, and airline capacity, 2024 vs 2025. That was my entire prompt.
This wasn’t a clean dataset. It was dozens of separate monthly CSV reports from a government website. Visitor arrivals, spending by category, airline seat capacity, source markets. Each one a separate PDF or spreadsheet download. The kind of data that normally takes half a day just to wrangle into something usable.
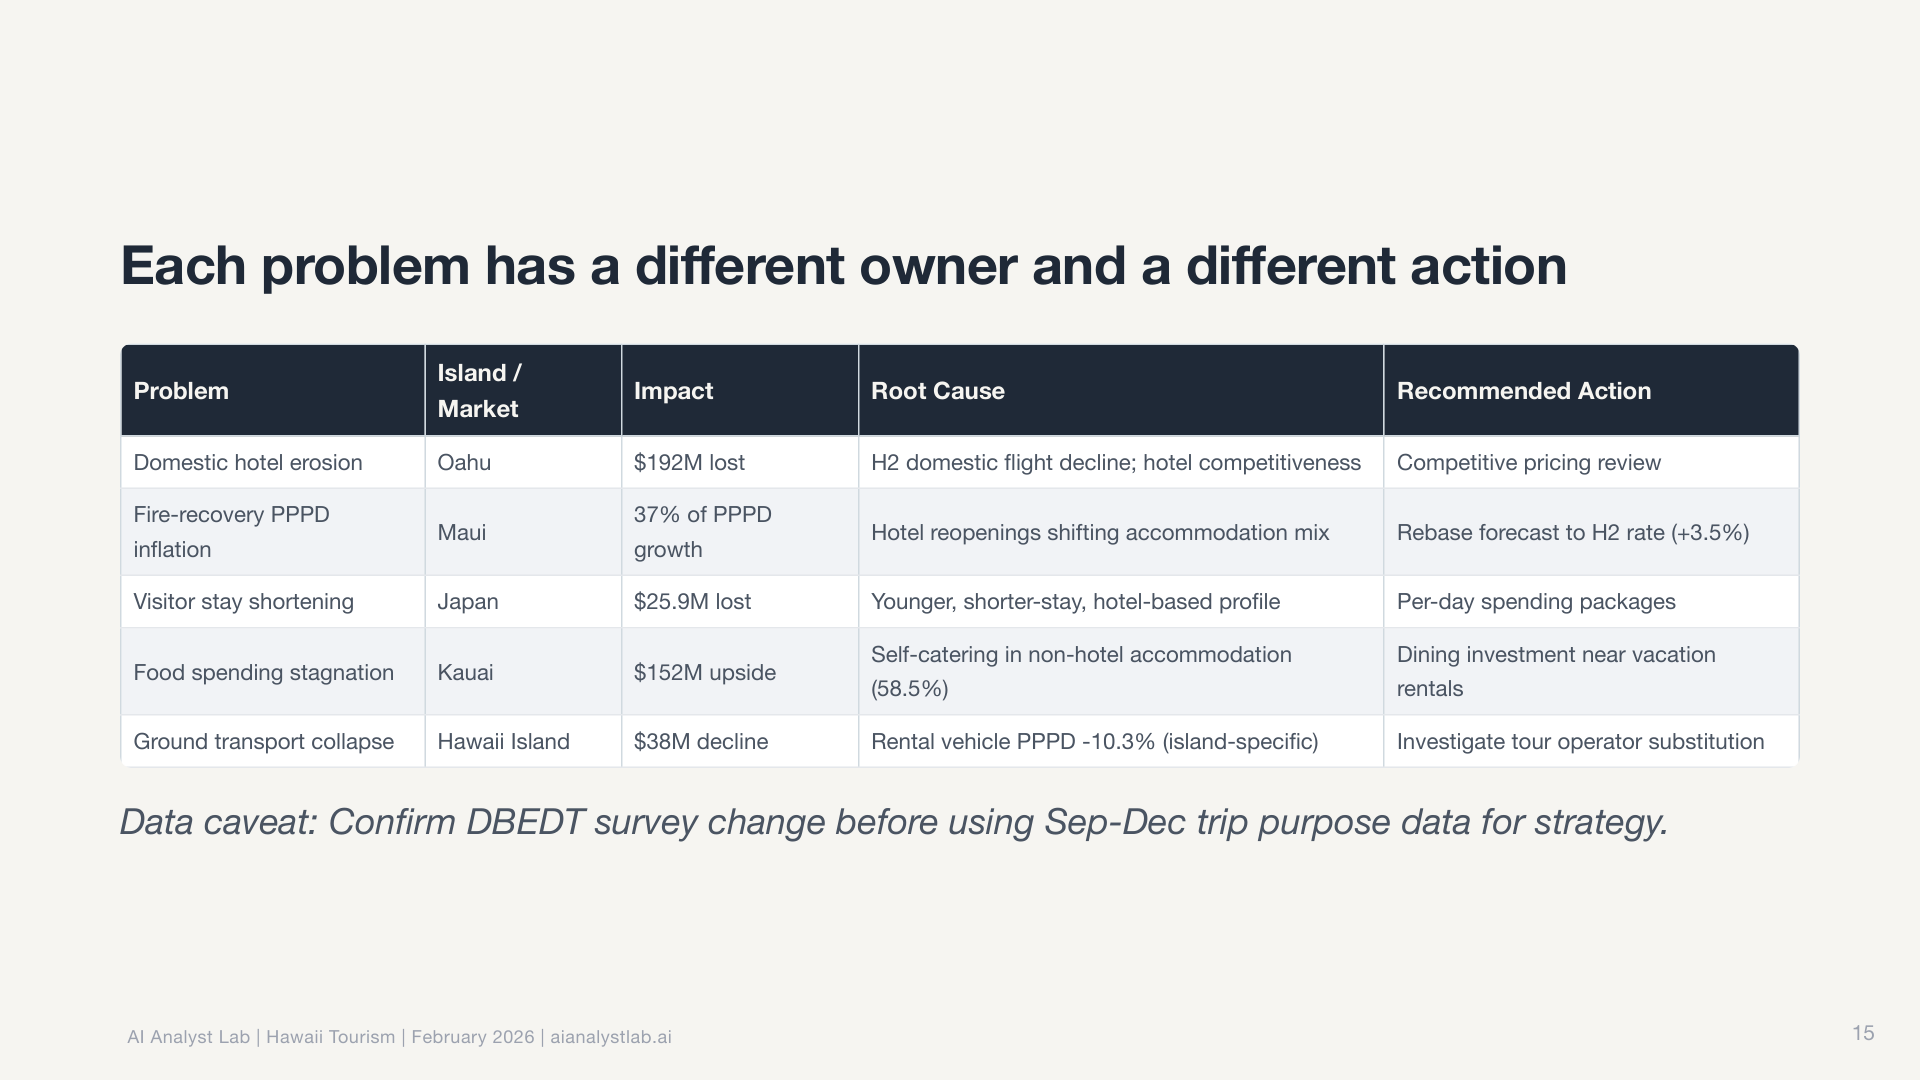
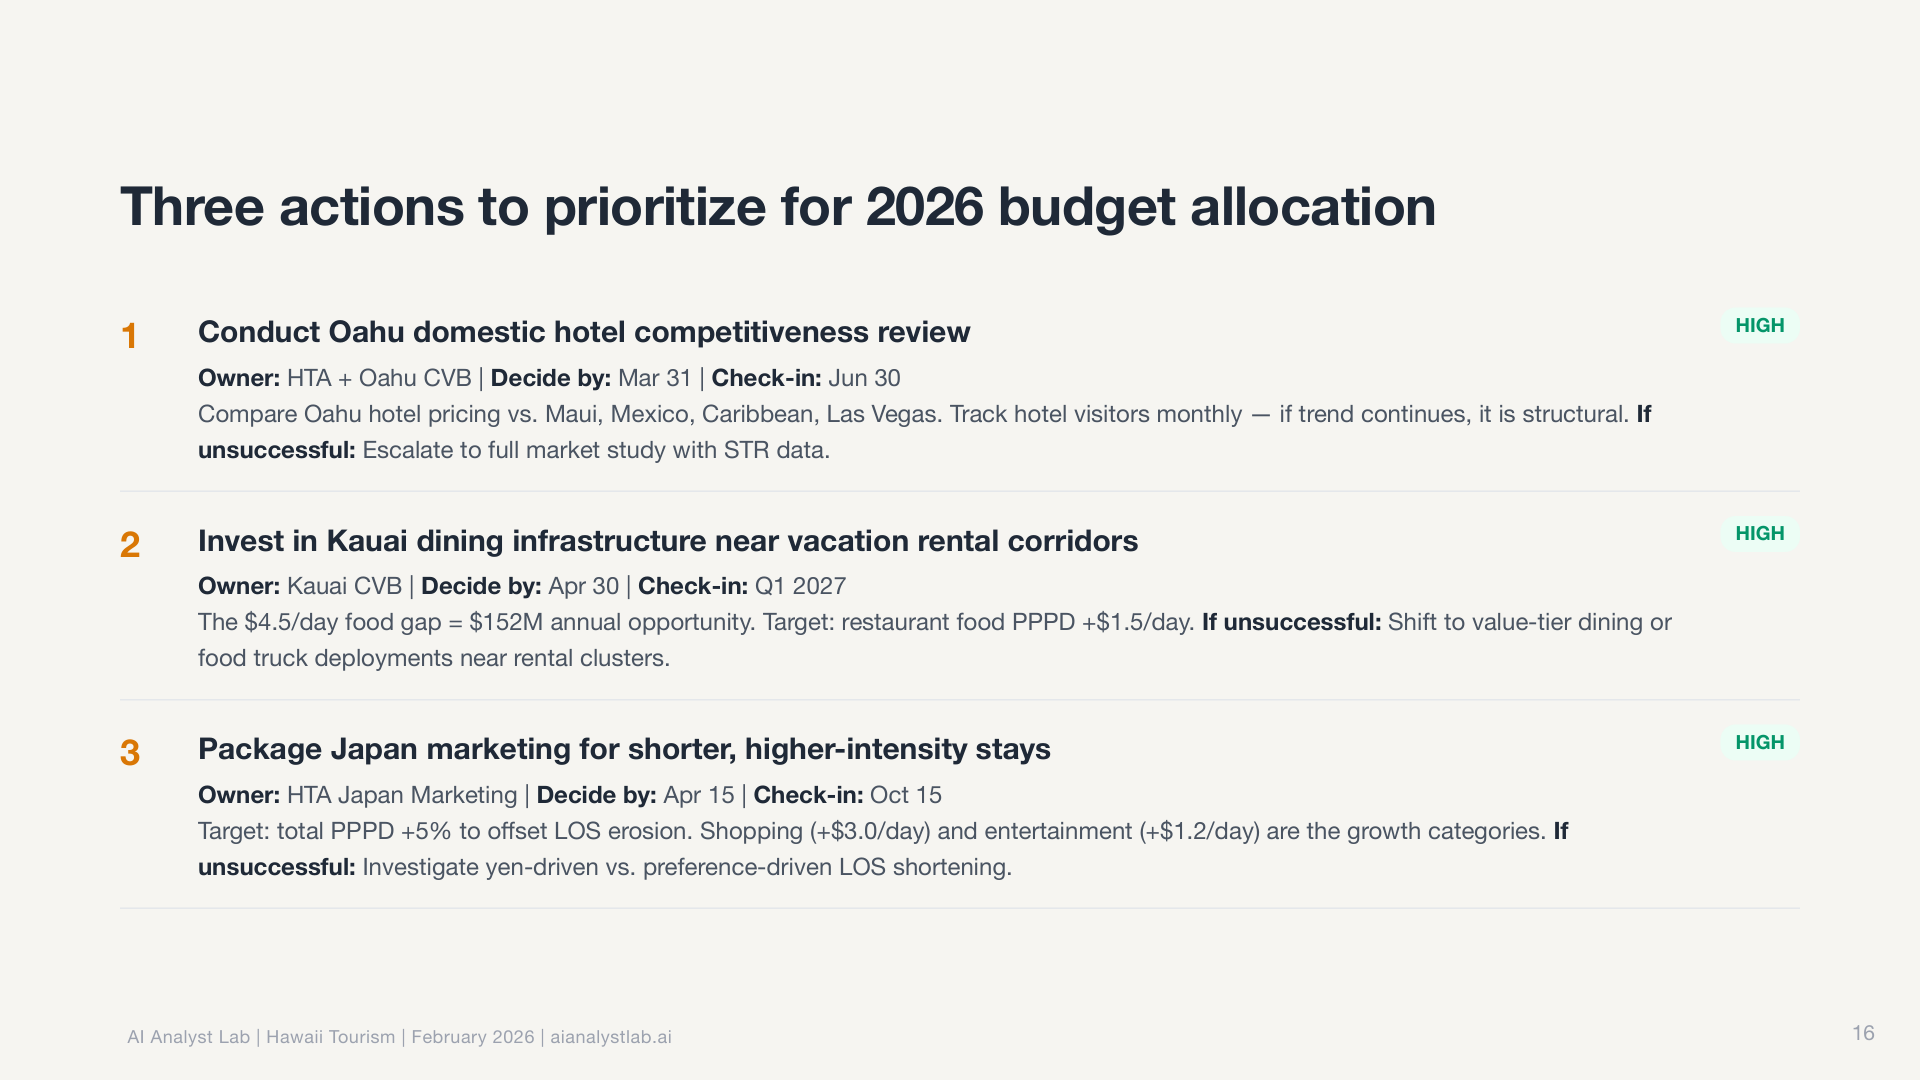
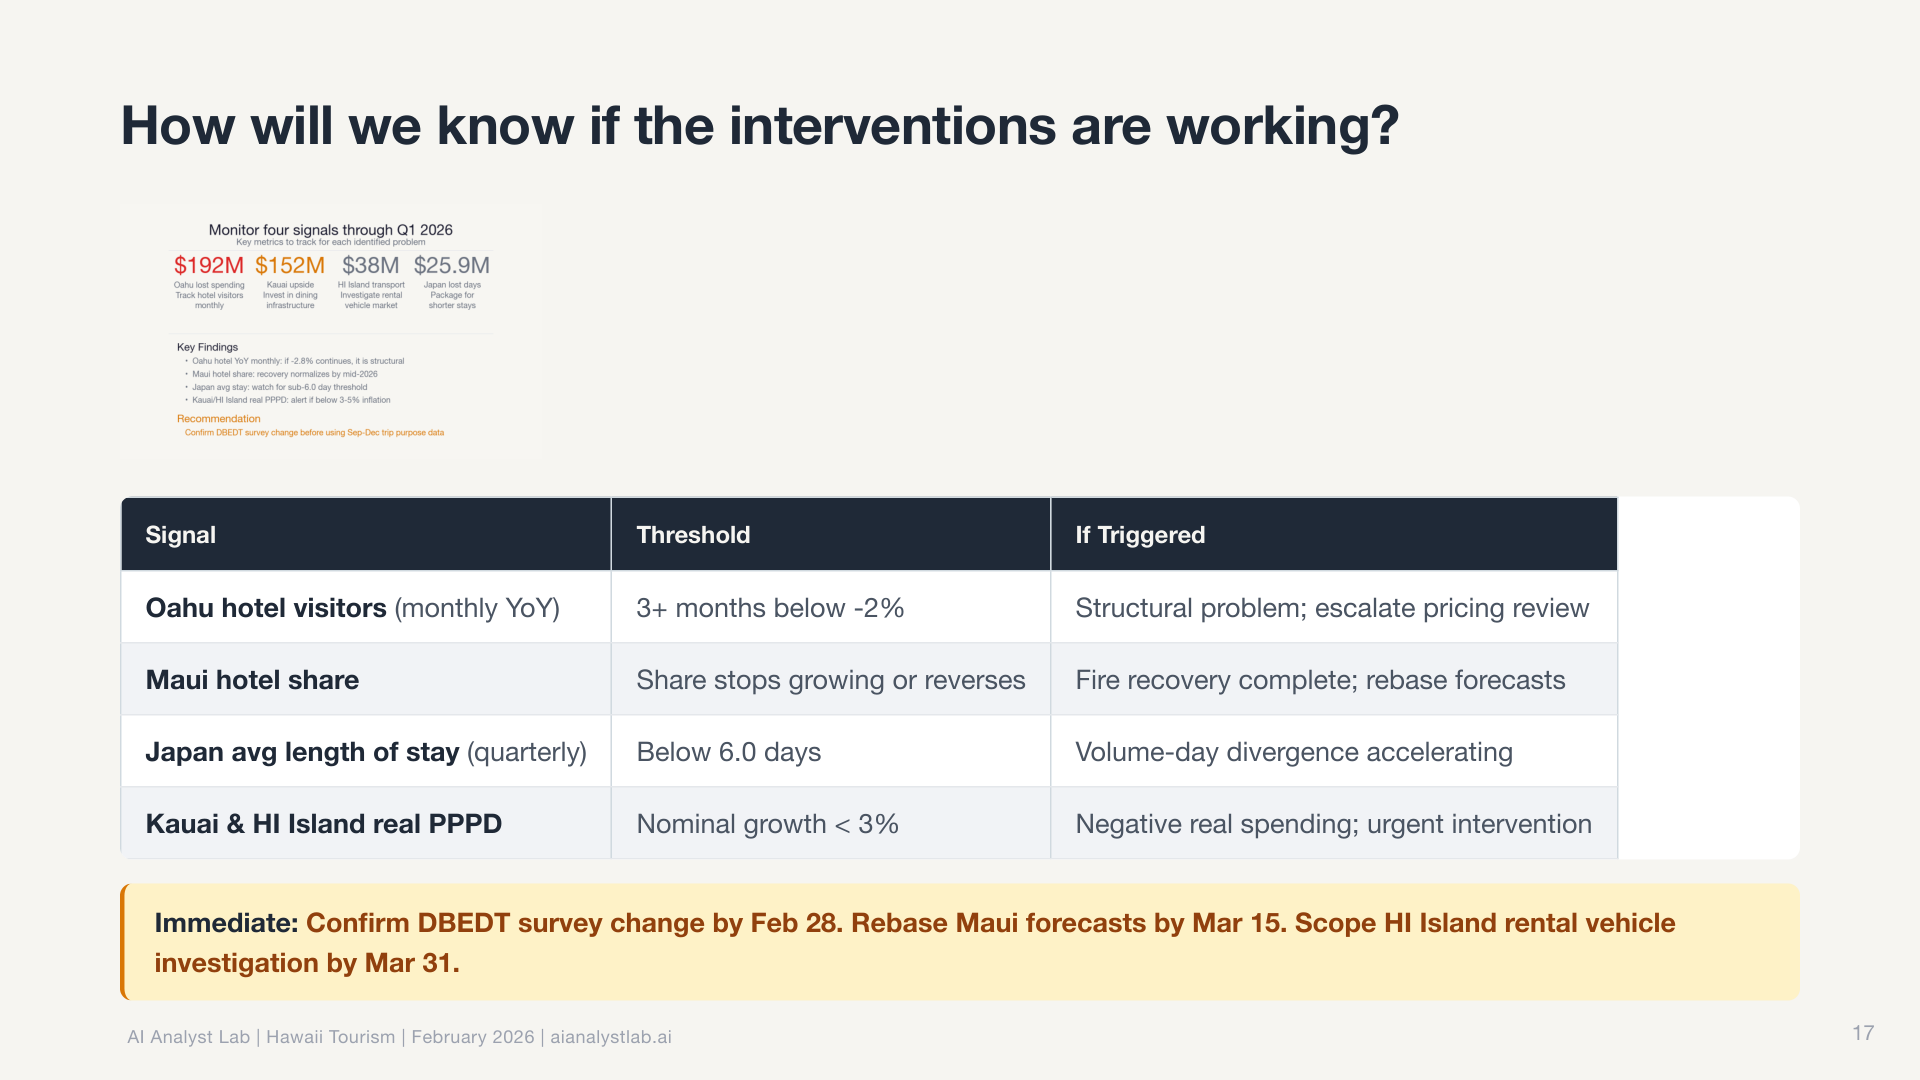
Fifteen minutes later, I had a complete slide deck. Not a rough draft. A finished presentation with a narrative arc, publication-ready charts, and actionable recommendations, each one tagged with a decision owner, success metric, and follow-up date.
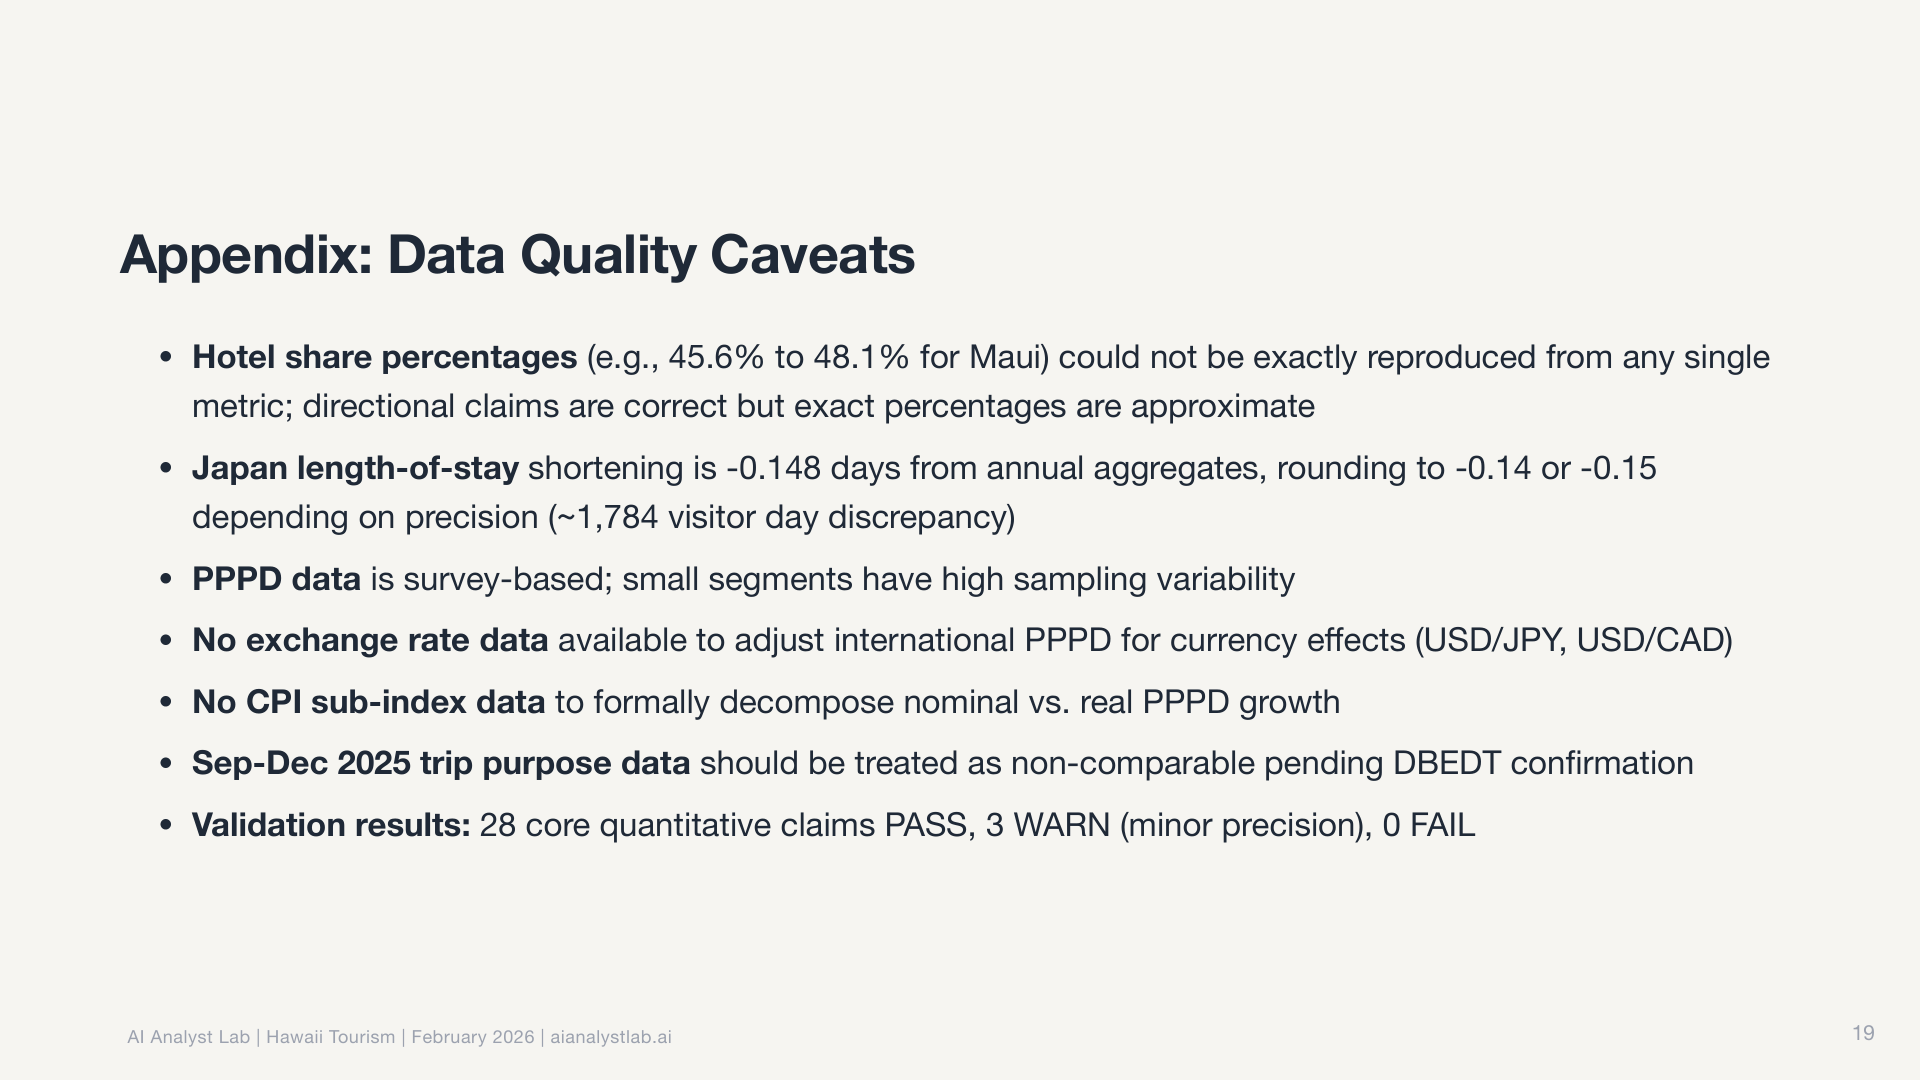
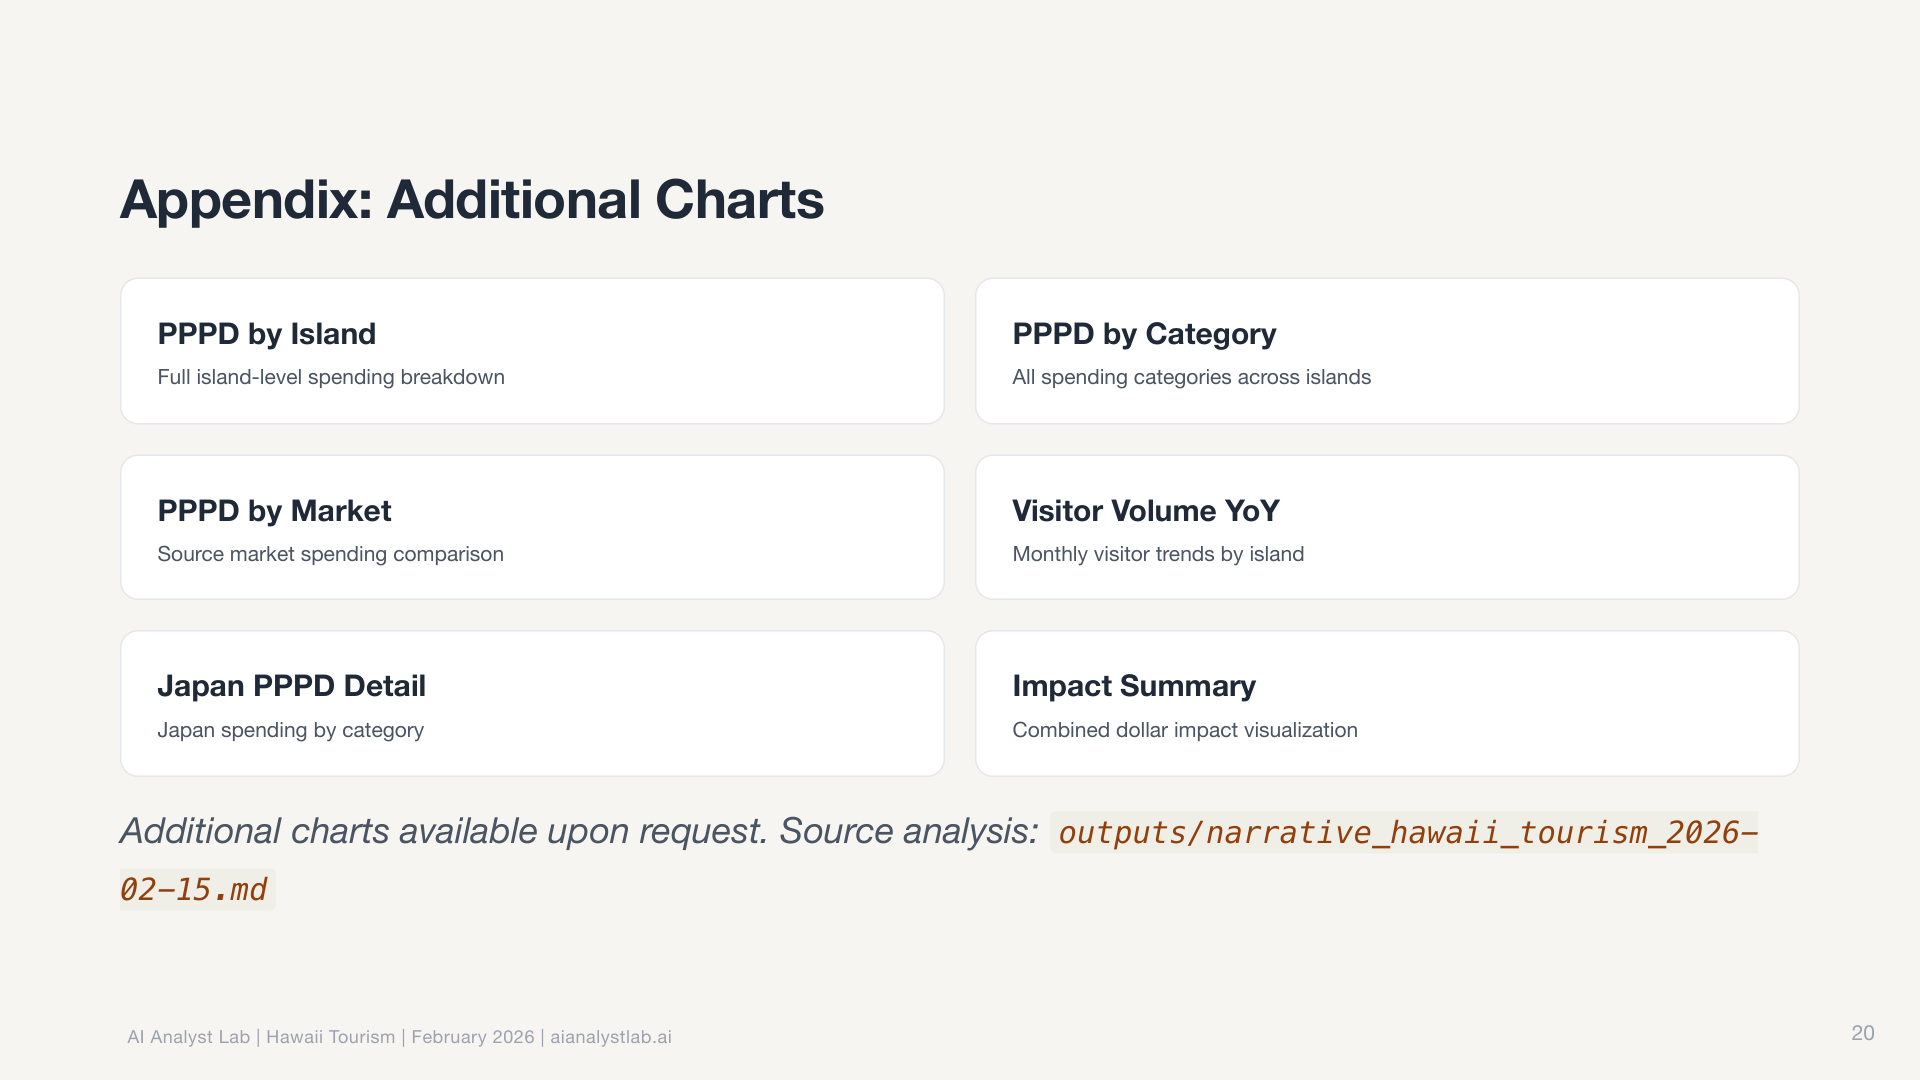
Here’s the full deck. Click any slide to zoom in. Download the PDF.

I didn’t write a single SQL query, make a single chart, or outline a single slide.
How the system works
It’s a system of markdown files that live in a repo.

The whole thing is controlled by one file: CLAUDE.md. Think of it as onboarding docs for a new analyst. It has six sections:
- Who You Are sets the persona in one line: “You are an AI Product Analyst.”
- What You Do defines scope and boundaries. Funnel analysis, segmentation, drivers analysis, yes. Predictive modeling, dashboards, no.
- Your Skills is a registration table. Each skill has a name, a file path, and a trigger condition. When the trigger matches, Claude Code reads and follows that skill automatically.
- Your Agents is another registration table. Each agent has a name, a file path, and an invocation condition. You call agents on demand for specific multi-step tasks.
- Default Workflow is the step-by-step playbook: frame the question, explore the data, analyze, validate, tell the story, present.
- Rules are non-negotiable guardrails: “always validate SQL before presenting results,” “never present unvalidated findings as conclusions.”
Everything the system does traces back to this one file. And it’s plain text. Editable by anyone.
Skills vs agents
This is the core distinction that makes the whole system make sense.
Skills define HOW things get done. They’re standards, patterns, rules. Like a style guide. They’re always active. When Claude Code generates a chart, the visualization patterns skill automatically applies. When it starts an analysis, the data quality check skill runs without being asked. You don’t invoke a skill. It applies itself whenever the trigger condition matches.
Agents define WHAT gets done. They’re multi-step workflows with inputs, steps, and outputs. You invoke them on demand: “run the descriptive analytics agent on this dataset.” Each agent reads its markdown file, substitutes the variables you provide, and executes the workflow step by step.
The connection: skills tell agents what “good” looks like. Change the chart color palette in the visualization skill, and every agent that makes charts (descriptive analytics, chart maker, storytelling) produces different-looking output. You didn’t touch any of those agents. You changed one skill file. That separation is what makes the system modular and composable.
The pipeline: 15 agents across 6 phases
The full workflow uses 15 agents and 12 skills organized into six phases. Some phases run in parallel (the Explore agents can work simultaneously on different angles of the data). Others are strictly sequential (nothing gets charted until the story architect designs the narrative arc). Four explicit checkpoints gate the process. If the Simpson’s Paradox check hasn’t run, if chart titles collide with slide headlines, if recommendations aren’t ranked by confidence, the pipeline halts until the issue is fixed.
Phase 1: Frame
- Question Framing turns a vague ask into structured analytical questions with decision context
- Hypothesis generates testable theories across four cause categories
Phase 2: Explore (agents run in parallel where inputs allow)
- Data Explorer profiles what data exists, its structure, and its quality
- Descriptive Analytics runs segmentation, funnels, and drivers analysis
- Overtime/Trend finds patterns over time, seasonality, and anomalies
- Root Cause Investigator drills down iteratively through dimensions, up to seven layers deep
- Opportunity Sizer quantifies business impact with sensitivity analysis
- Experiment Designer designs A/B tests with power estimation and decision rules
Phase 3: Validate
- Validation re-derives key numbers independently (writes new queries, not copies) and cross-checks arithmetic. Flags common traps like Simpson’s Paradox and survivorship bias.
Phase 4: Story (sequential, each step feeds the next)
- Story Architect designs narrative beats following a Context/Tension/Resolution arc. The number of beats is emergent, not a target.
- Narrative Coherence Reviewer validates story flow before any charting begins
- Storytelling writes the narrative from the storyboard
Phase 5: Charts
- Chart Maker generates each chart following Storytelling with Data methodology
- Visual Design Critic reviews against a checklist: action titles, direct labels, gray-first-then-color
Phase 6: Deliver
- Deck Creator assembles Marp slides with theming, breathing slides for pacing, and speaker notes. Runs a final design review.
Twelve skills run throughout, shaping how every agent works:
- Analysis: data quality check, question framing, analysis design spec, triangulation
- Metrics: metric spec, tracking gaps, guardrails
- Output: visualization patterns, presentation themes, stakeholder communication
- Process: close-the-loop, run-pipeline (orchestrates the whole thing)
What surprised me: the judgment
The SQL, the charts, the database, the slides. That’s all impressive execution. But the part that actually surprised me was the analytical judgment.
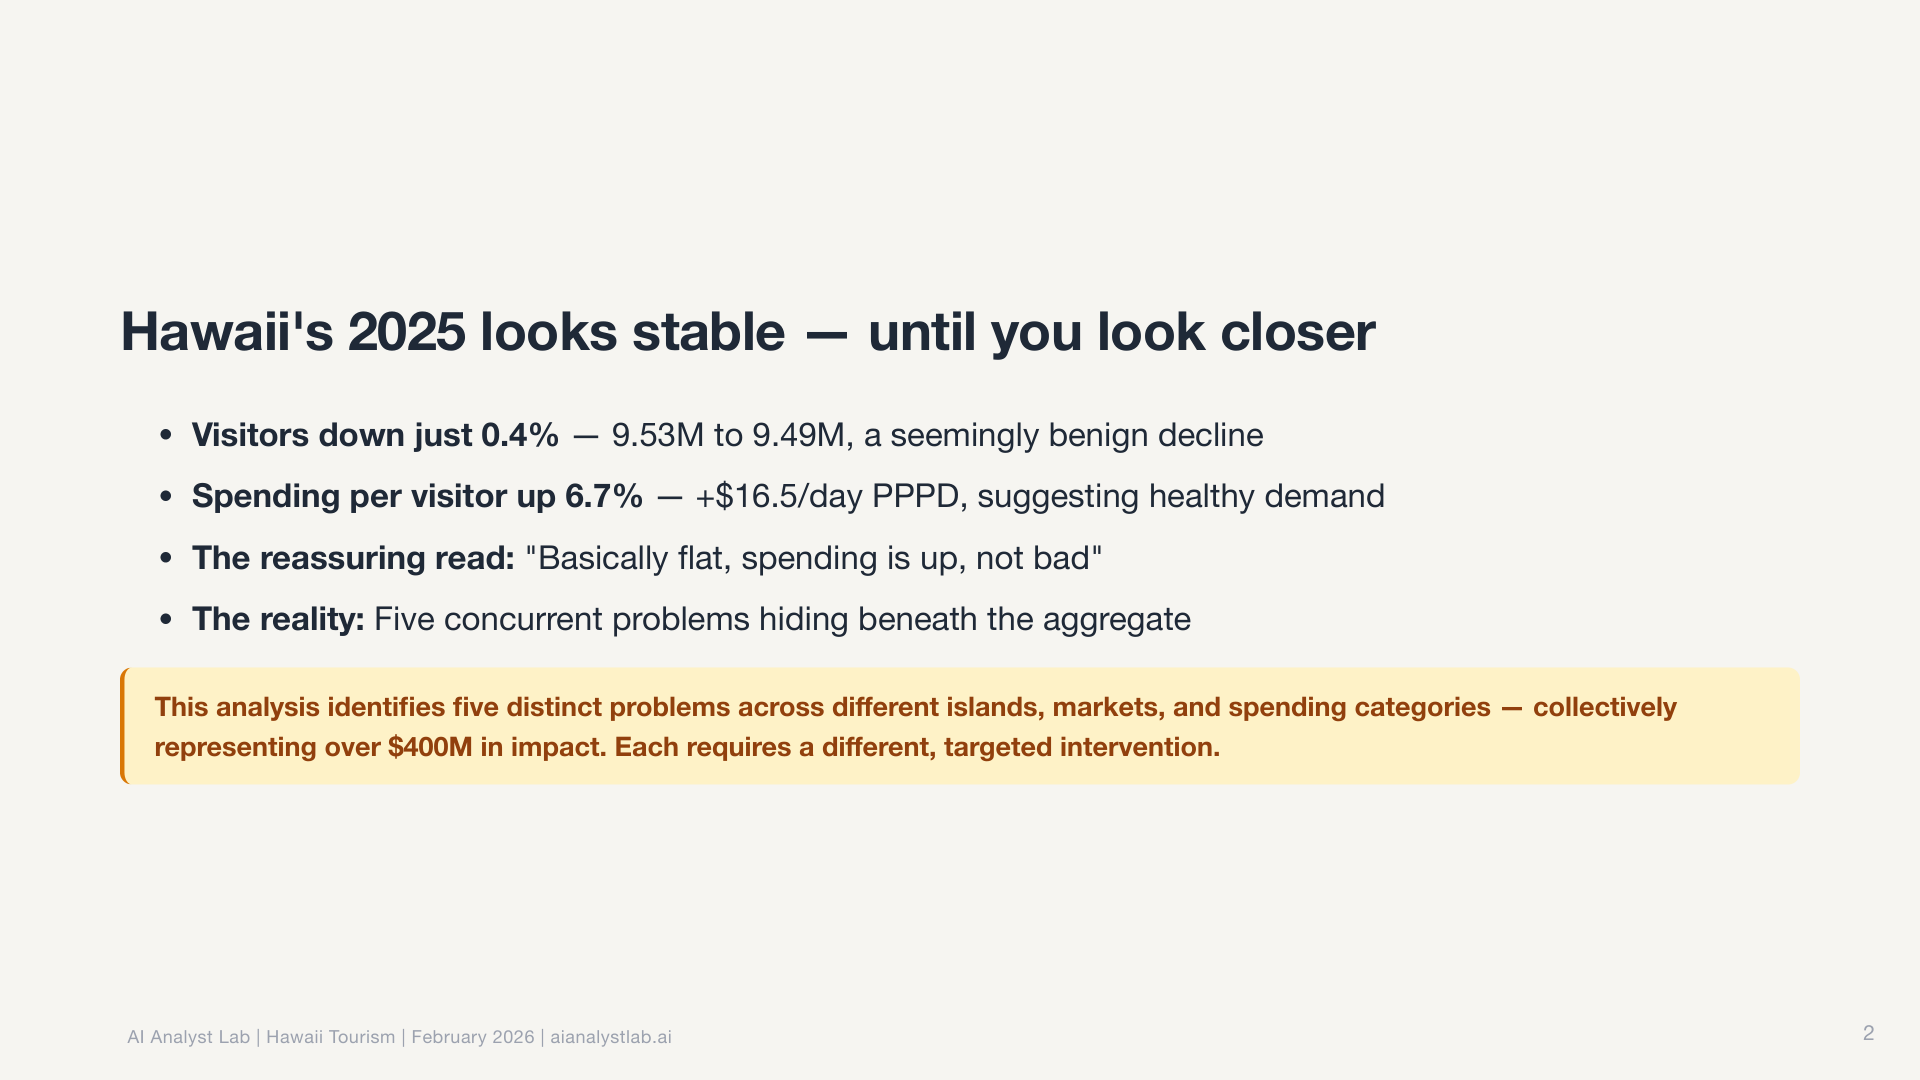
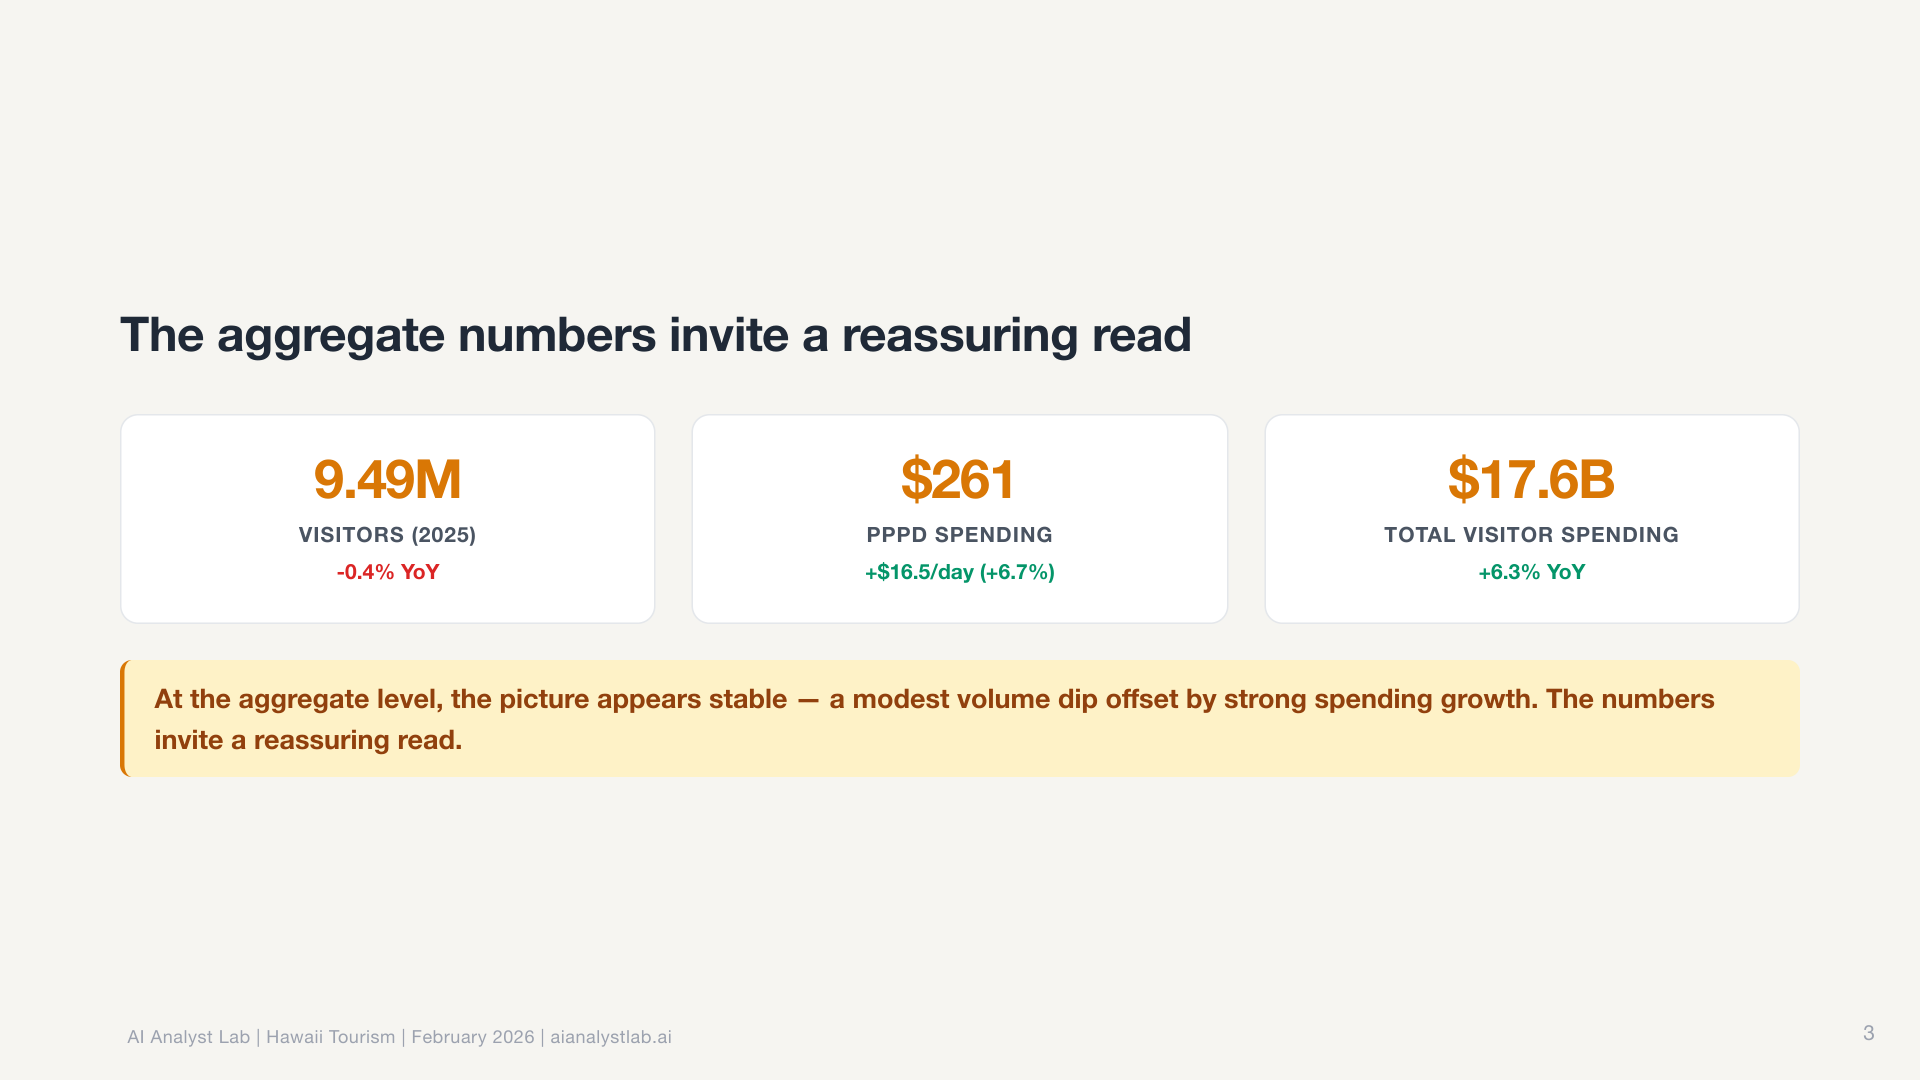
In the Hawaii data, the statewide visitor count was essentially flat. Down 0.4% year over year. Most tools would report “no significant change” and move on.
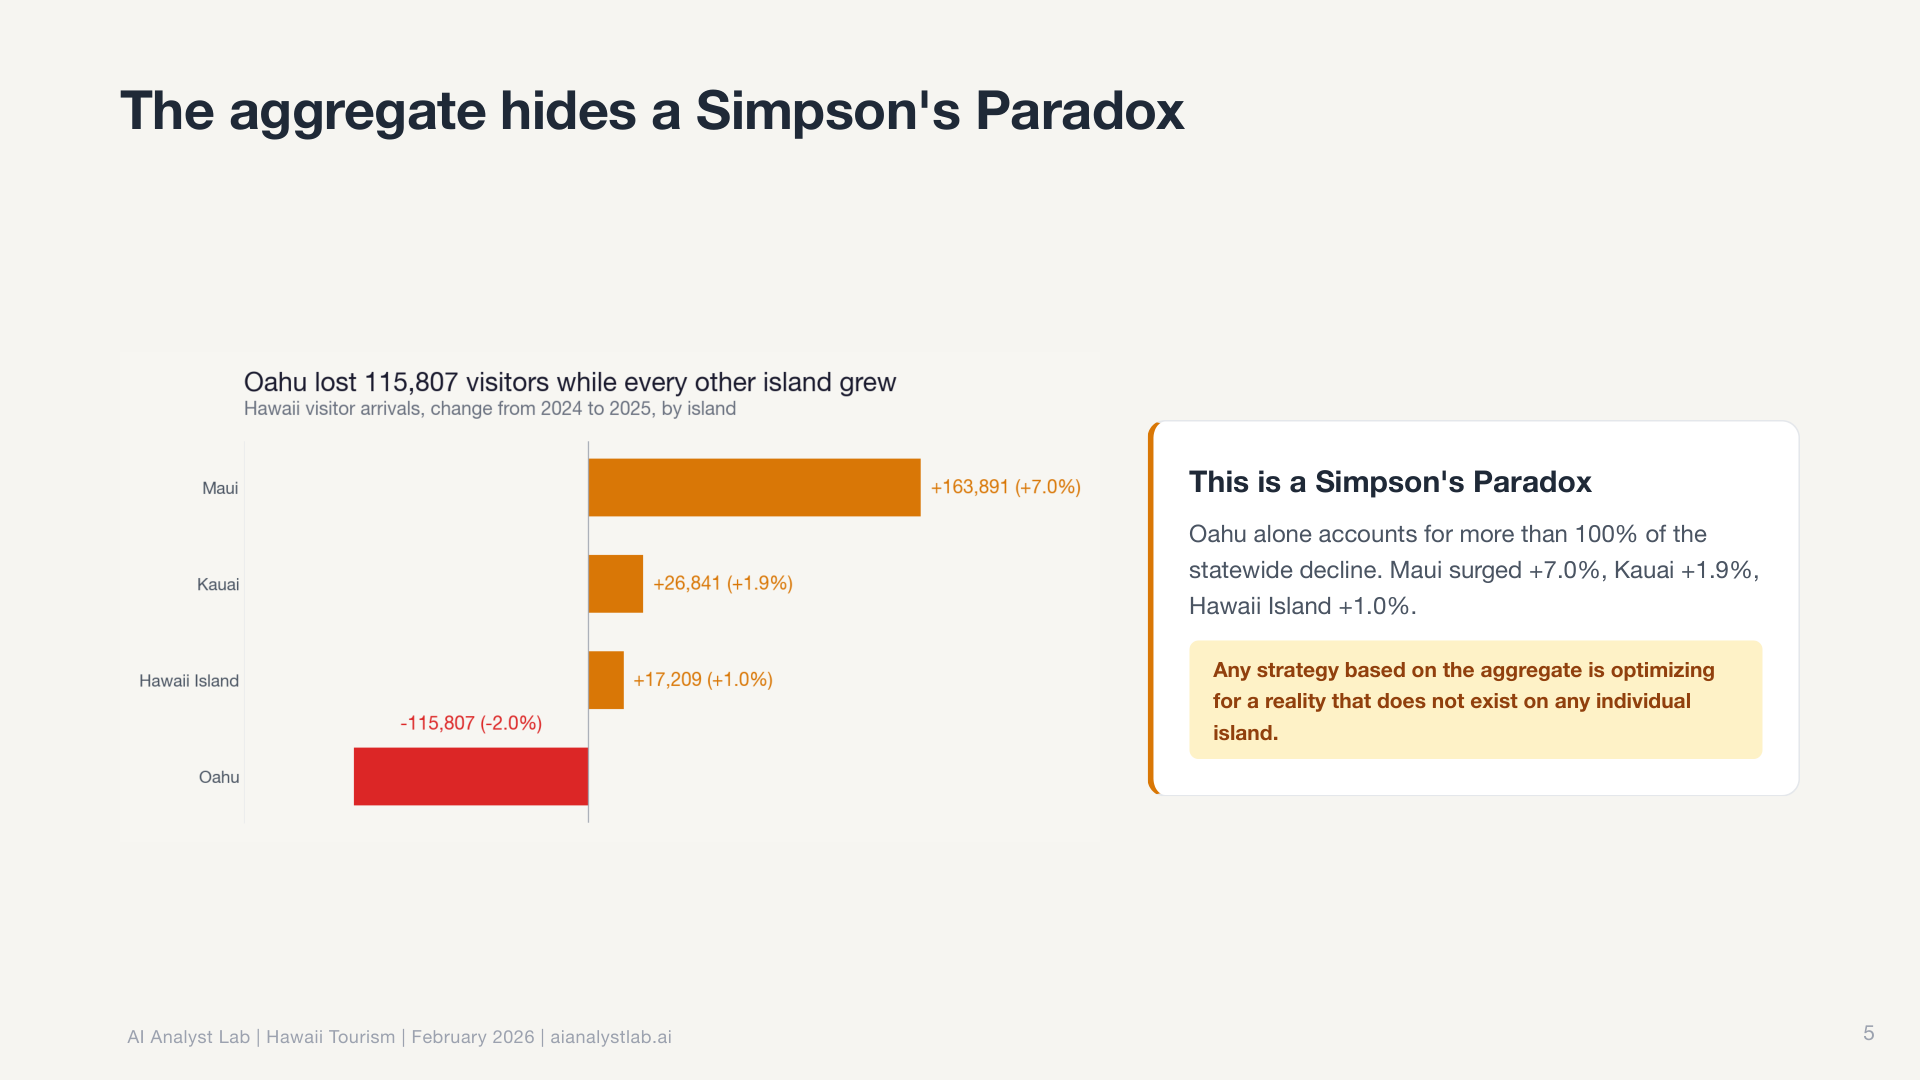
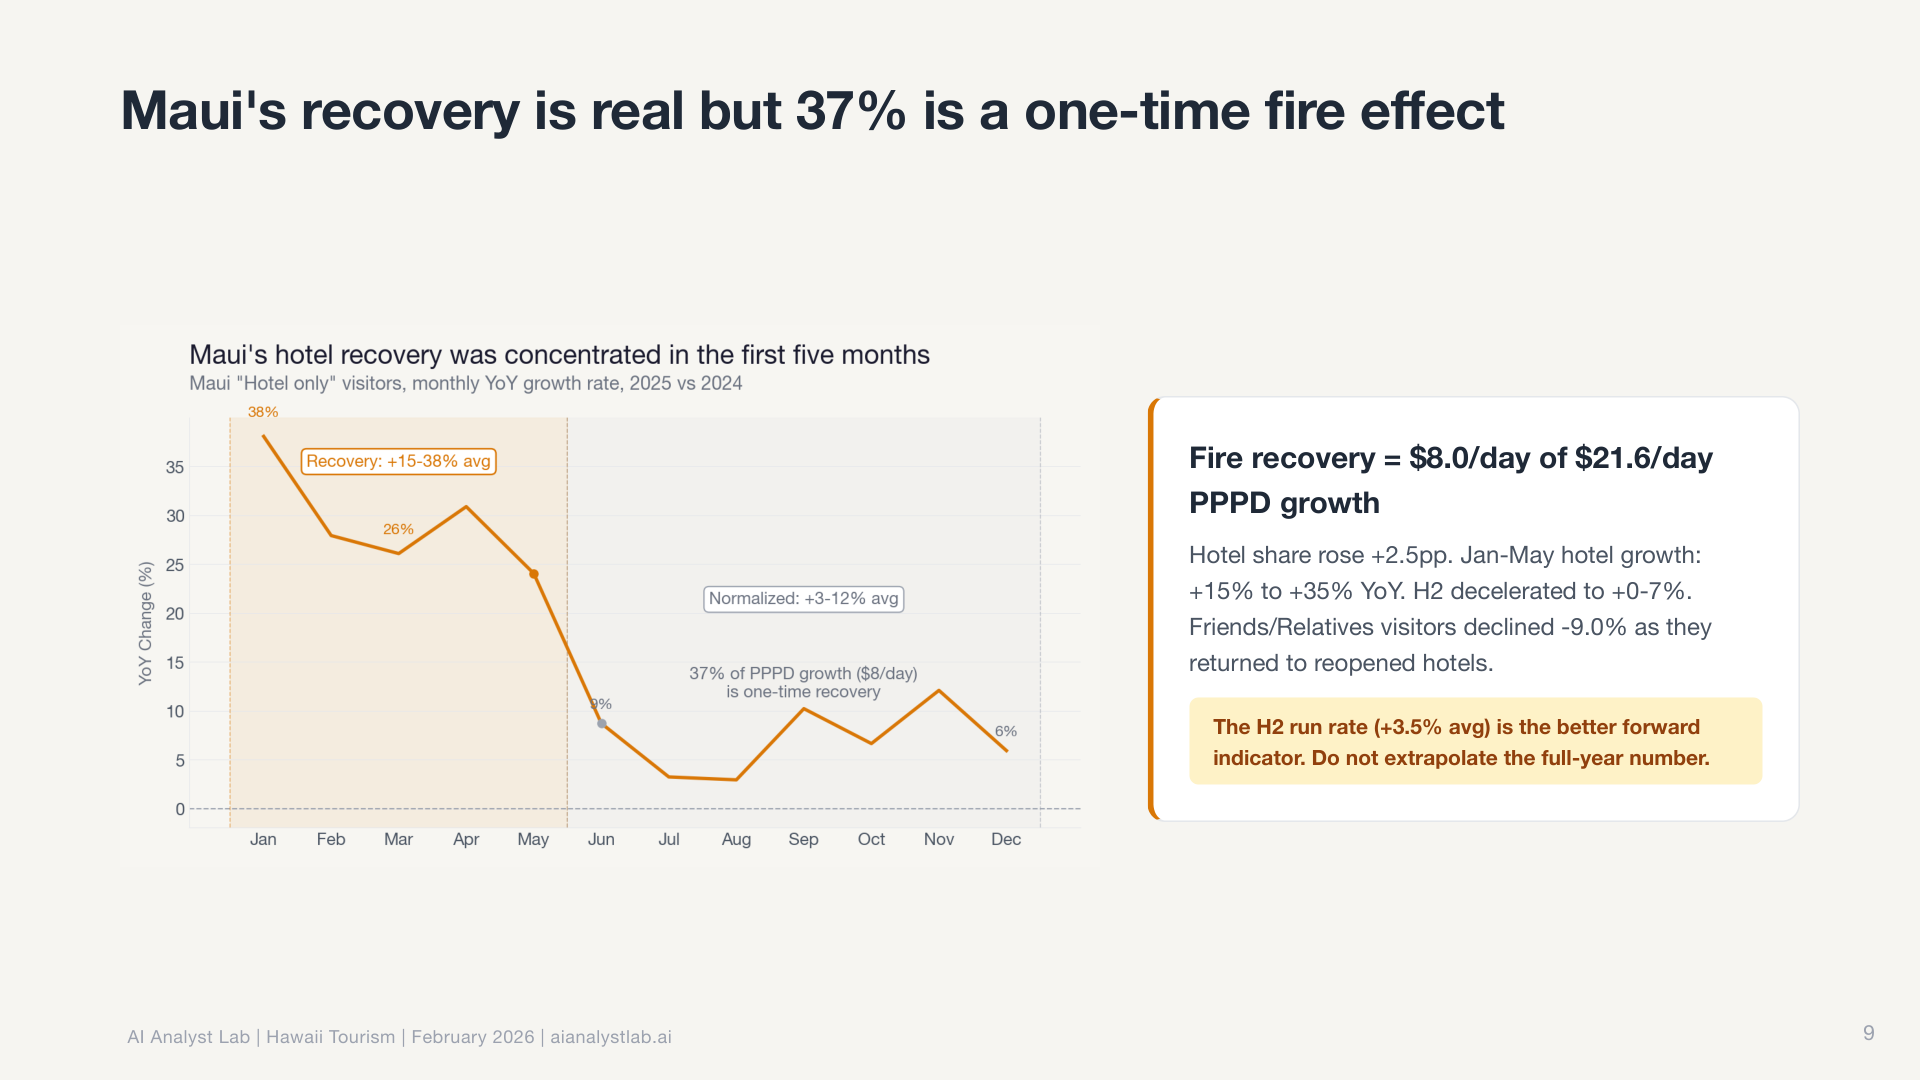
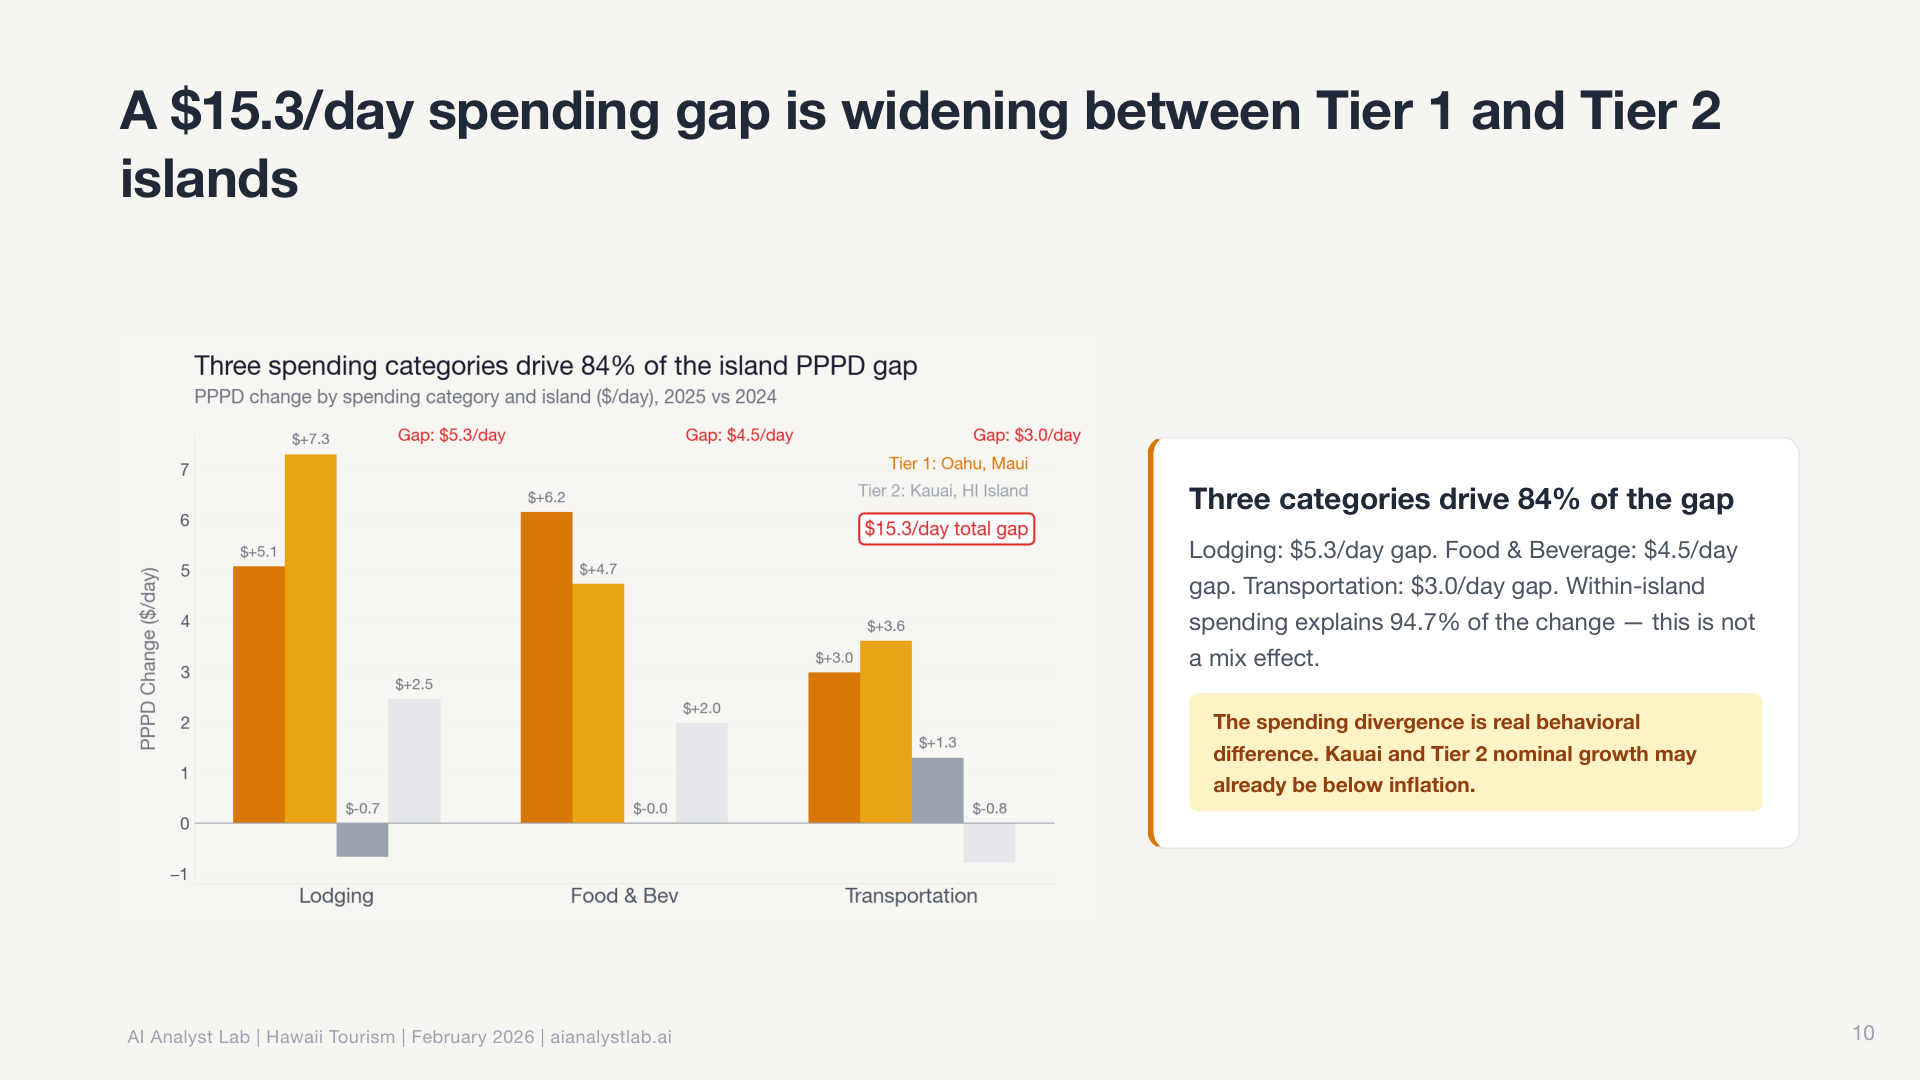
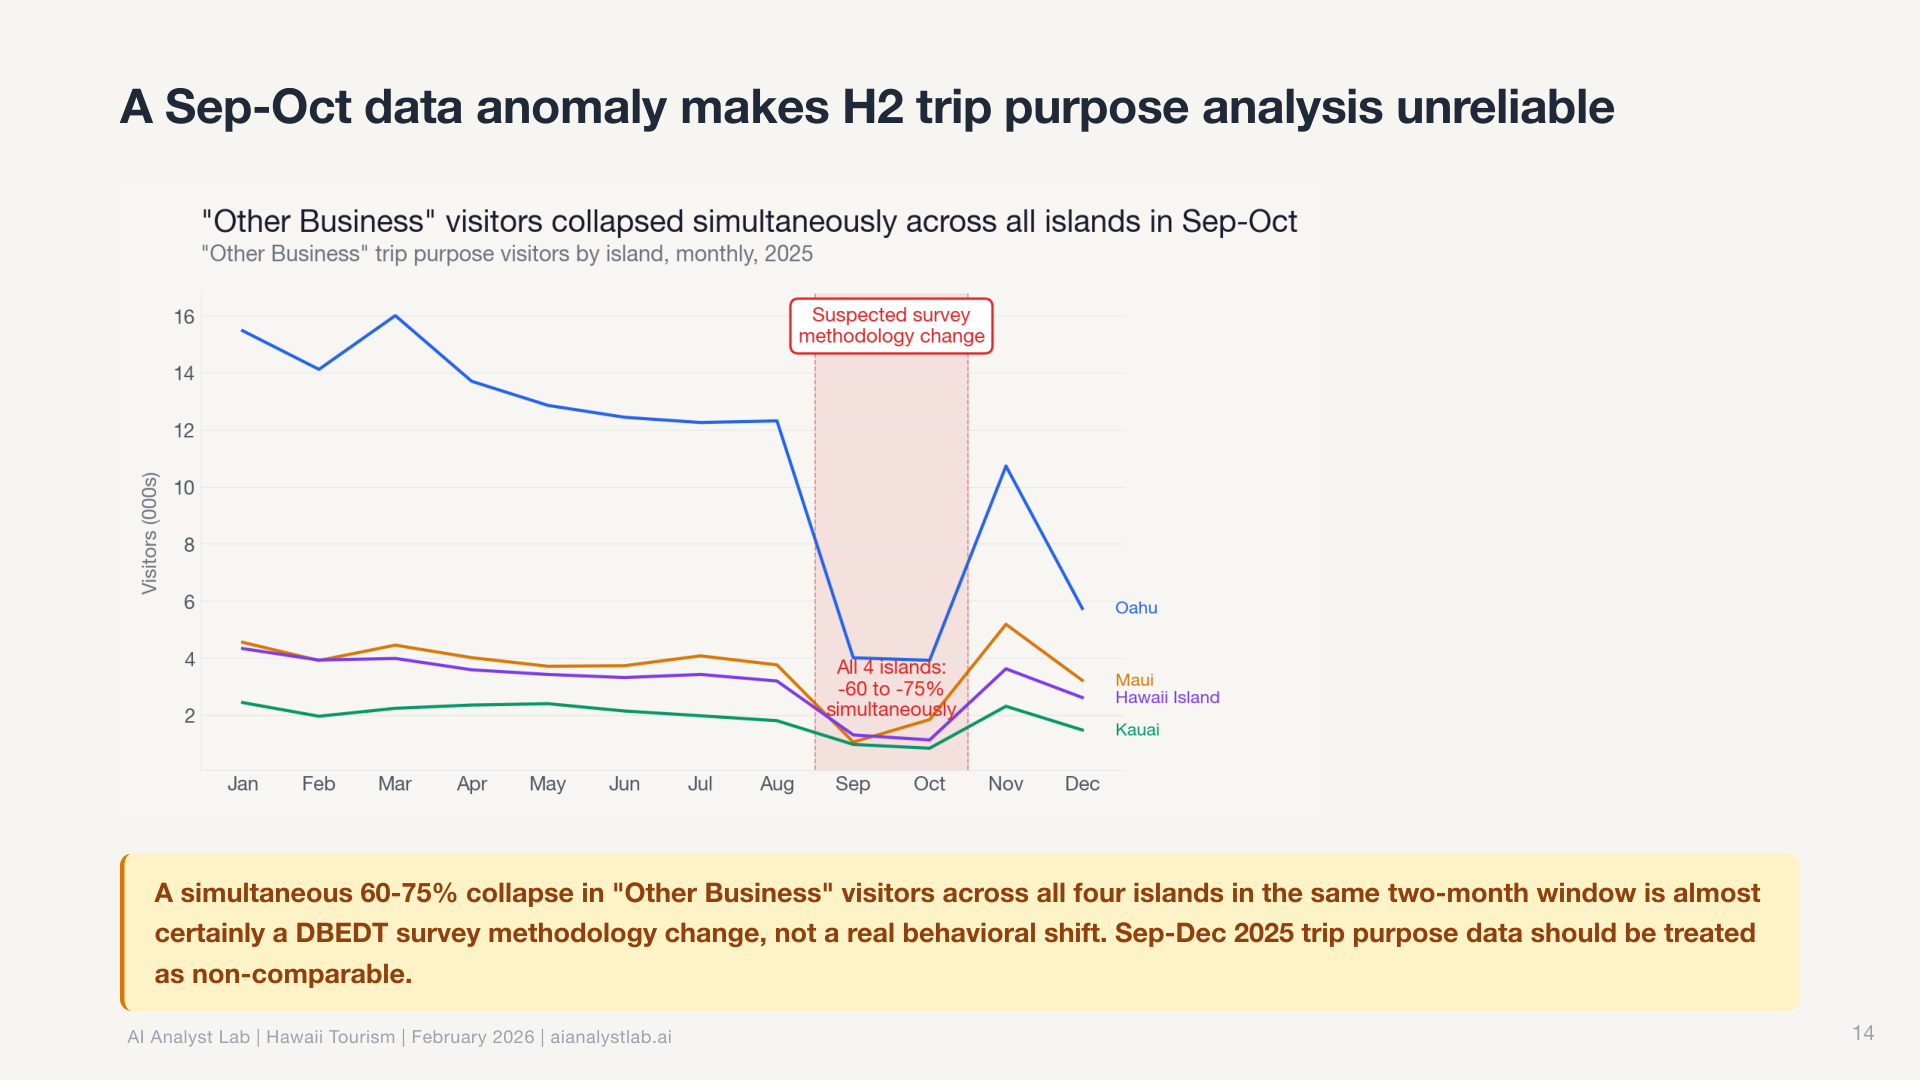
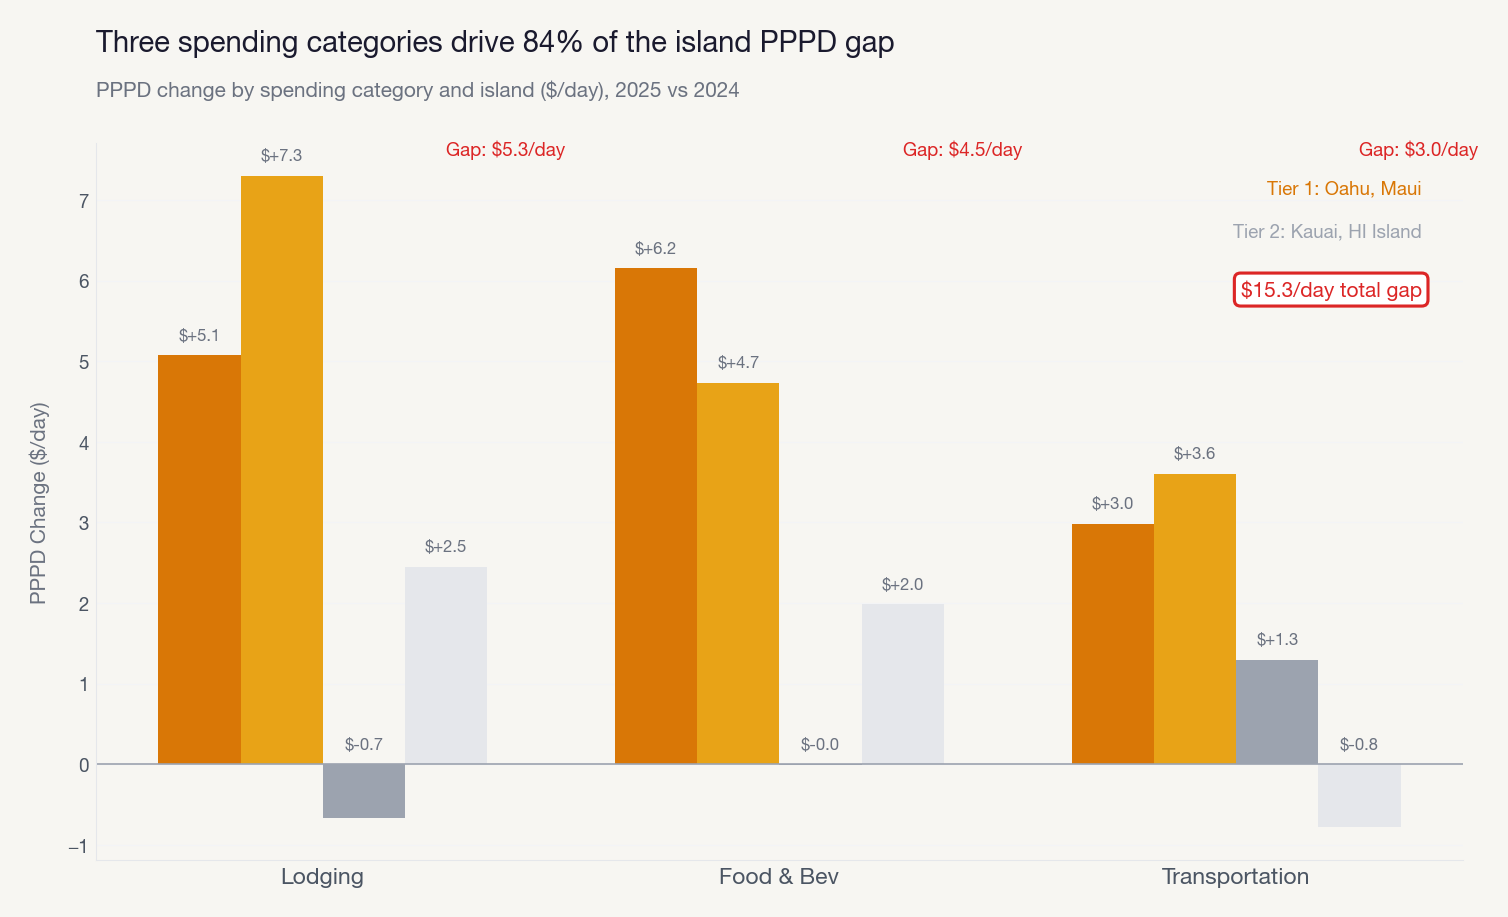
The descriptive analytics agent includes a mandatory Simpson’s Paradox check. Even when the aggregate looks flat, it automatically segments by default dimensions (geography, channel, device, cohort) to see if opposite trends are hiding underneath. In this case, they were. Maui had surged 7% while every other island declined. The aggregate was hiding completely opposite trends. The agent caught it unprompted because the check is built into the workflow, not dependent on me asking the right question.
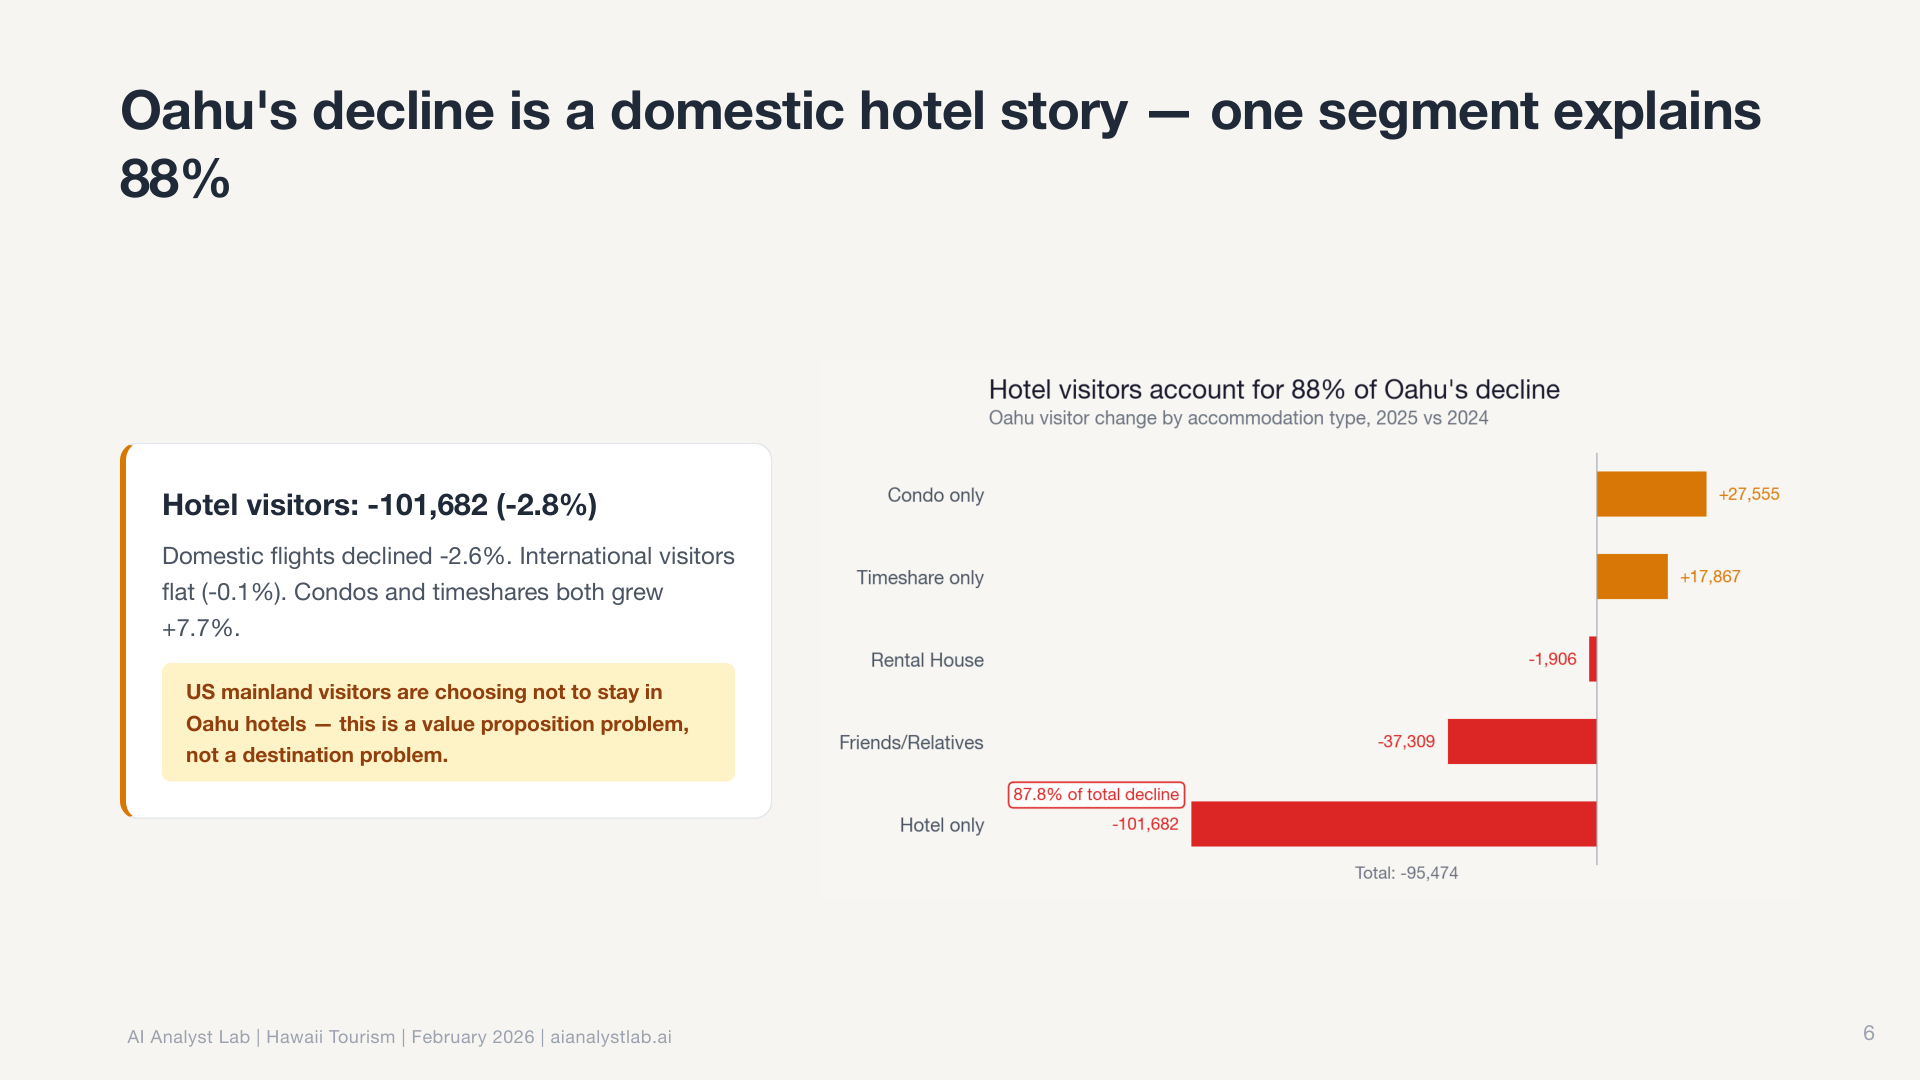
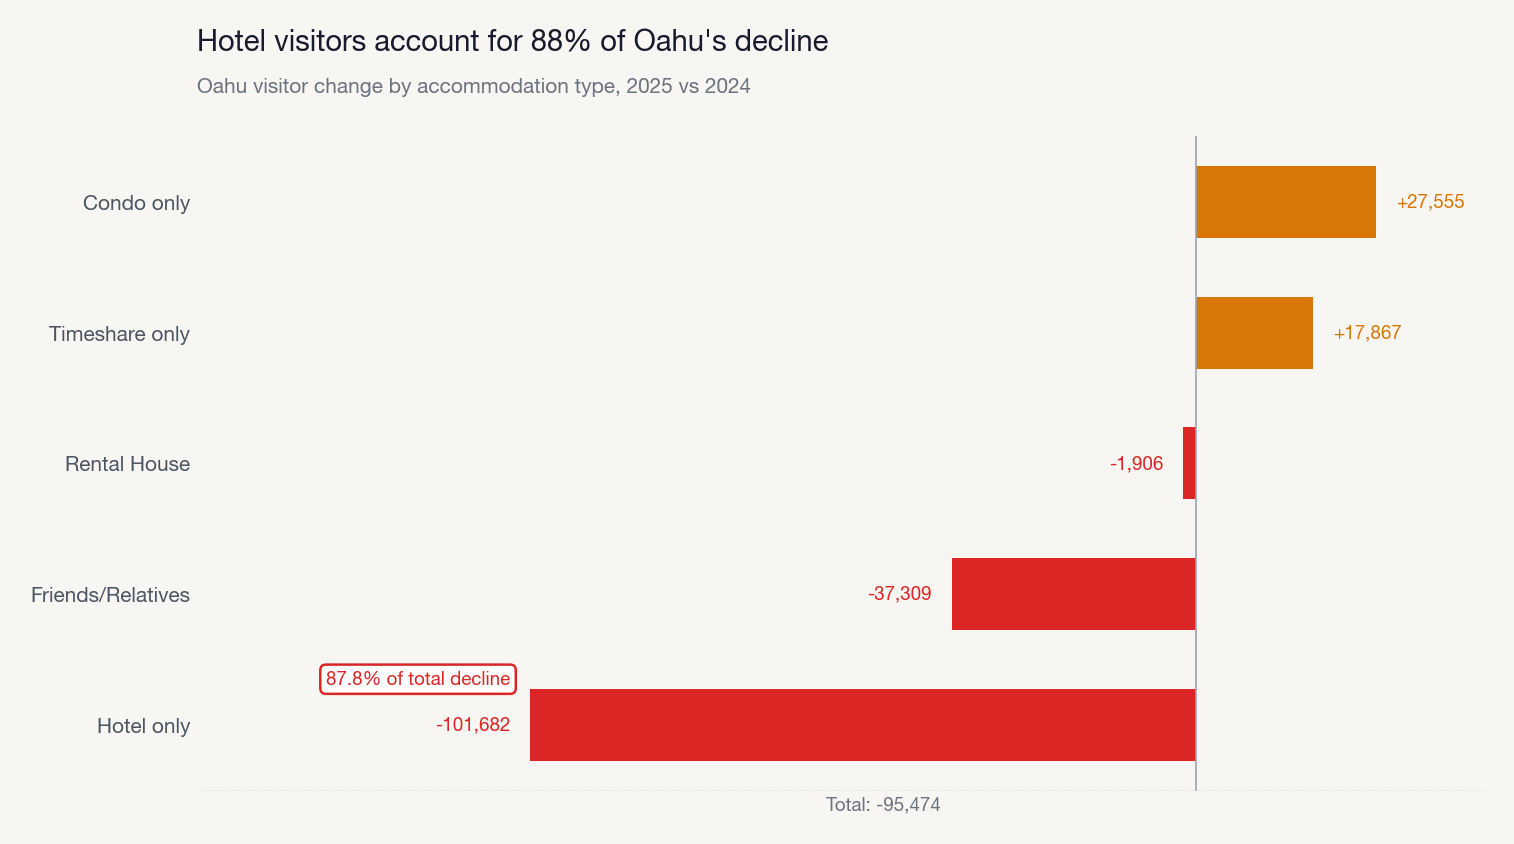
Then it decomposed O’ahu’s decline by accommodation type, finding that hotel visitors drove the loss while vacation rentals held steady.
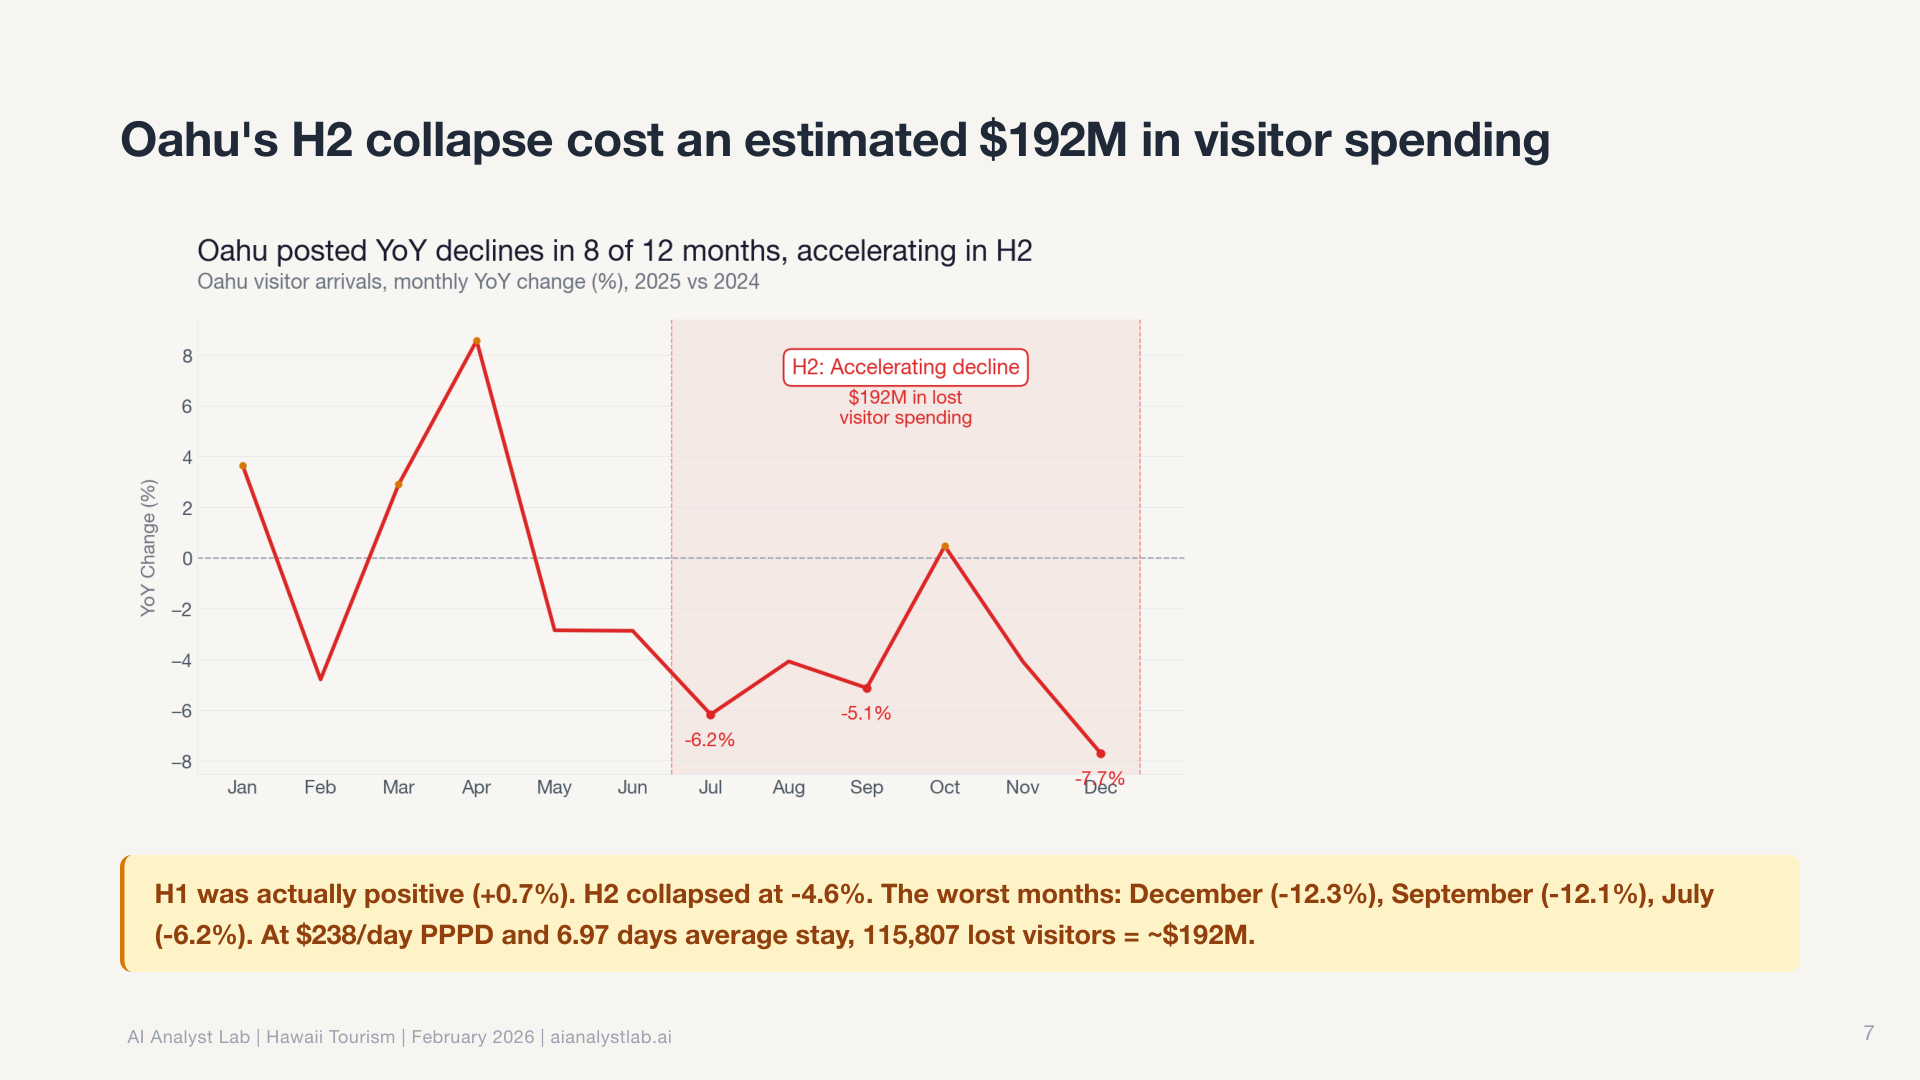
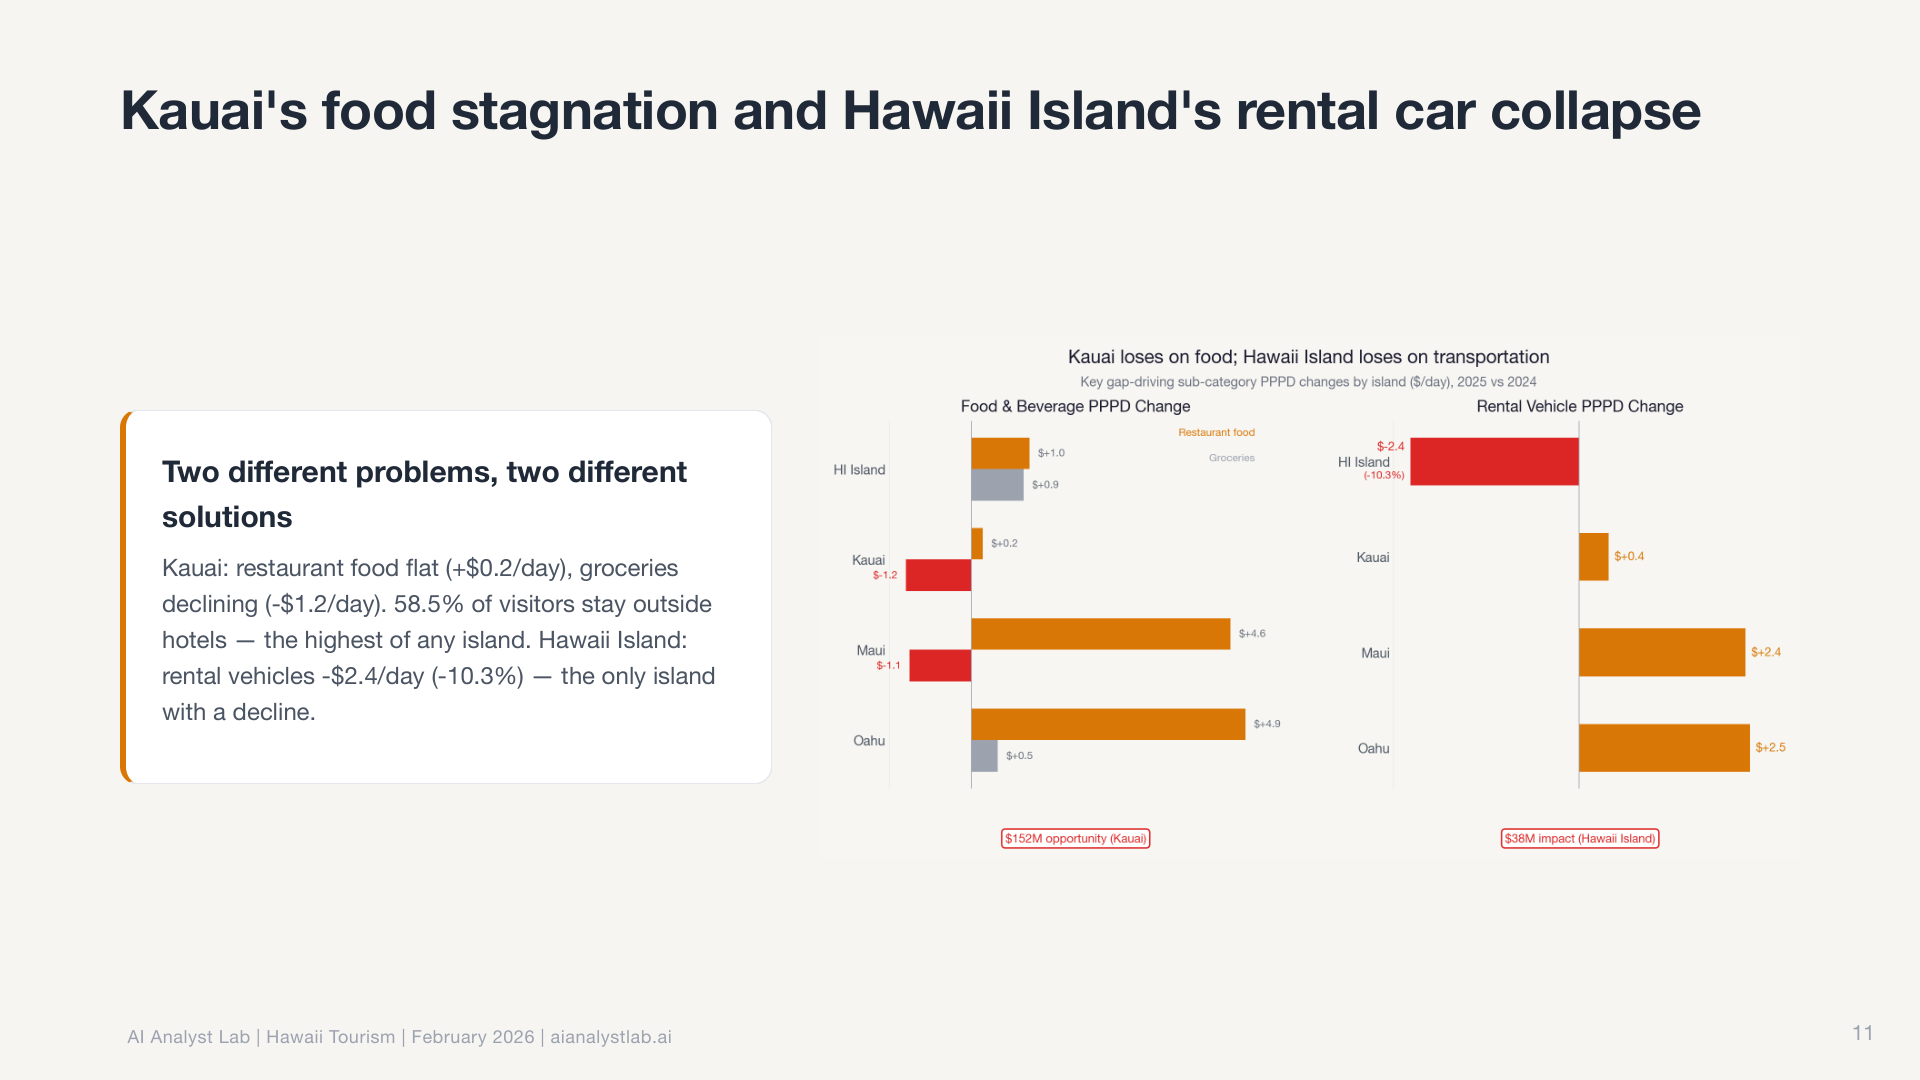
The root cause investigator went further. It follows a “peel the onion” approach: start with the surface observation, test each available dimension to find which explains the most variation, isolate the specific segment responsible, then repeat. Up to seven iterations deep. It doesn’t stop at “Maui is different.” It drills into which source markets, which routes, which months are driving the divergence.
The validation agent then re-derives the key numbers independently and cross-checks with the triangulation skill. No finding makes it to the narrative without arithmetic verification.
And the charts reflect it. Every chart follows Storytelling with Data principles: action titles that state the takeaway, direct labels instead of legends, gray everything first and use color only for the story point.
The story architect then takes all the findings and designs a narrative arc. Context, Tension, Resolution. The number of beats and charts is an emergent property of the story, not a target. The narrative coherence reviewer validates that each beat’s transition question is answered by the next one. No gaps, no orphaned insights, no charts that don’t earn their place in the deck.
It gets better every time
The one-shot quality is impressive, but it’s not the most important part. It gets better every time you use it.
The Hawaii analysis was the second major run. The first was on NovaMart, a synthetic e-commerce dataset. That analysis was good, but I gave it specific feedback afterward. What happened next is what makes this approach fundamentally different from prompting a chatbot.
I told it the chart titles were duplicating the slide headlines. It didn’t just fix the charts in front of me. It updated three separate agent files (chart-maker, deck-creator, and visual-design-critic) and added a validation check so the issue would never recur on any future dataset.
I told it the narrative voice was too corporate and dramatic. It rewrote its own storytelling rules and added voice guidelines to the story-architect and storytelling agents. Now every analysis comes out in the right voice automatically.
I pointed out that chart annotations were colliding with data points on dense charts. It added collision detection logic to the chart-maker agent and a specific review criterion to the visual-design-critic.
This is the key difference between a chat-based AI workflow and a system-based one. In a chat tool, you start fresh every time. There’s no institutional memory. Here, every piece of feedback becomes a permanent improvement to the system files themselves. The agents, the skills, the rules. Self-improving configuration, all living in the project repo, compounding with every run.
If you’ve ever built a team knowledge base or maintained runbooks that get better over time, you already understand this pattern. The difference is that here, the system can update its own documentation based on what it learns.
How we built it
You don’t need to replicate the full 18-step pipeline to get started. But the process matters. There’s a six-step build pattern that applies to building any skill or agent:
1. Explore. Brainstorm with Claude Code. Don’t build anything yet. Talk about what you want to build, what problem it solves, who the output is for, what “good” looks like. The brainstorm that kicked off our system was a one-hour conversation that covered audience, scope, constraints, and exit outcomes before we touched a single file.
2. Spec. Tell Claude Code what you want the skill or agent to do. It writes the specification for you: purpose, trigger conditions, instructions, examples, anti-patterns. You review. You talk through it. Claude Code creates the markdown file.
3. Plan. Claude Code breaks the spec into a concrete file list. What files need to be created, where they live, what each one contains.
4. Build. Claude Code writes the files. Skills go in .claude/skills/. Agents go in agents/. Each one is a markdown file with plain English instructions. Human readable, human editable if you want, but Claude handles the creation.
5. Test. Run on real data. Look at the output. Does the chart theme match? Did the agent follow all the steps? Did it miss anything?
6. Iterate. Give specific feedback. Claude Code updates the files itself. Run again. Every cycle makes the output better.
The key thing: you never have to write these files by hand. You describe what you want in plain English and Claude Code creates them. I use a speech-to-text flow to dictate feedback while reviewing output. Talk, review, iterate. The entire system is markdown files that Claude Code reads and maintains.
We went through this loop multiple times before the Hawaii analysis. Each run produced noticeably better output. There’s no proprietary tooling. Just Claude Code and a well-structured project.
Build systems or get replaced by AI
This is building decks that are ready for me to walk into a Monday morning meeting and present to execs. Recommendations, action items, decision owners, follow-up dates. All from a single prompt. 90% of analysts and data scientists I know can’t operate at this level. Not because they lack the skill. Because they’re still doing everything manually, one query at a time.
The analysts who will thrive in the next few years aren’t the ones who run the best queries. They’re the ones who build systems. Who encode their analytical judgment into tools that compound over time. The rest will get replaced by Claude Code.
Open a terminal. Point Claude Code at a dataset. Ask a question. “Why did signups drop in January?” or “Which user segments have the highest engagement?” or “What’s driving the change in our conversion rate?” It frames the question, explores the data, runs the analysis, validates the numbers, and produces a narrative with charts you could present that afternoon.
Want to see this live before building your own? We’re running a free 2-hour workshop on February 27 where we walk through the system and run a live analysis. No commitment, just come watch it work.
If you want to build one yourself, the Build AI Analysts in Claude Code bootcamp runs April 4-5, 2026. Weekend intensive, eight hours total. You walk through the full six-step build pattern from brainstorm to working system. You leave with a complete repo: skills, agents, connected data sources, and a finished analysis you ran yourself. Three instructors providing real-time support. No coding experience required.
If you want to go deeper after that, we have a five-week course that teaches the full analytical workflow (question framing, metrics, deep dives, experimentation, storytelling) and how to build systems like this for your own work.
The tools are here. The gap is about to get obvious.